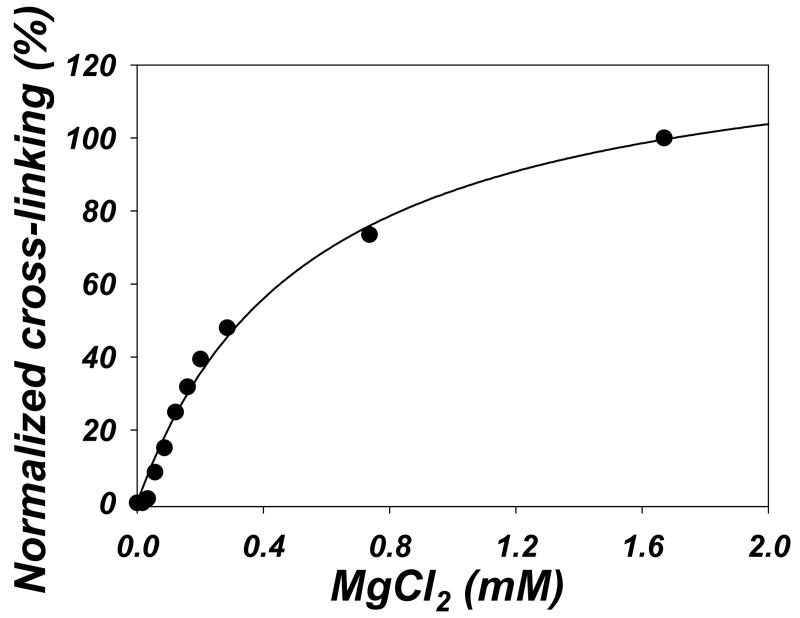
Figure 5. The efficiency of the cross-linking depends on Mg2+ concentration.
Actin-KabC (10 μM) complex was cross-linked by LFNACD (1 to 500 mole ratio) for 20 minutes in the presence of 200 μM ATP and increasing concentrations of MgCl2. The amount of actin cross-linked was analyzed as in Fig. 3B, normalized to 100%, and plotted as a function of free MgCl2 concentration in the solution (calculated by WinMAXC software, Version 2.40, Stanford University). Solid line represents single ligand binding fitting, with an apparent Kd = 0.54 mM.

