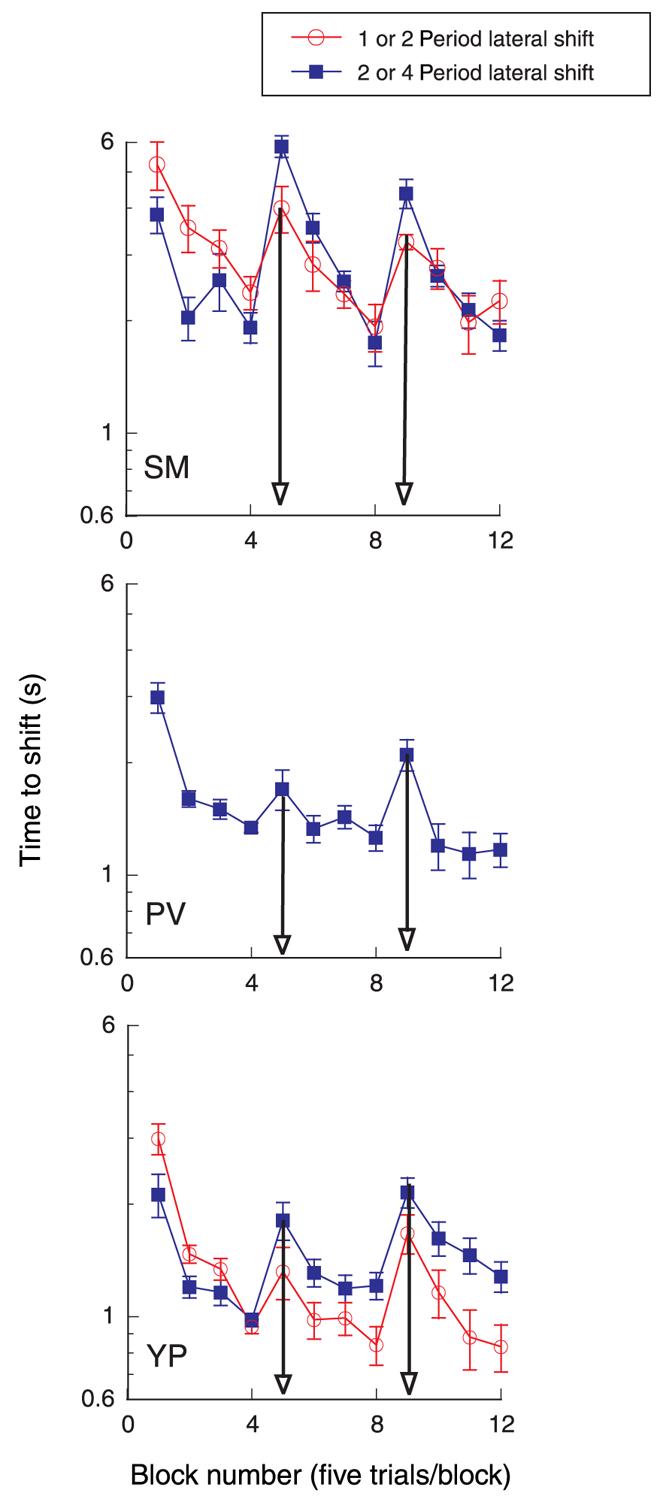
Figure 3.

Average time to shift for sequential blocks of five trials. After four blocks (20 trials), the 6°-wide, 3-cpd grating segment was repositioned laterally to the right or to the left. Edge disparity = 20 arcmin; contrast = 50%. Blue curve shows lateral shift right two periods after 20 trials, then left four periods after 40 trials. Red curve shows lateral shift right one period, then left two periods. Arrows show block when shift occurred.
