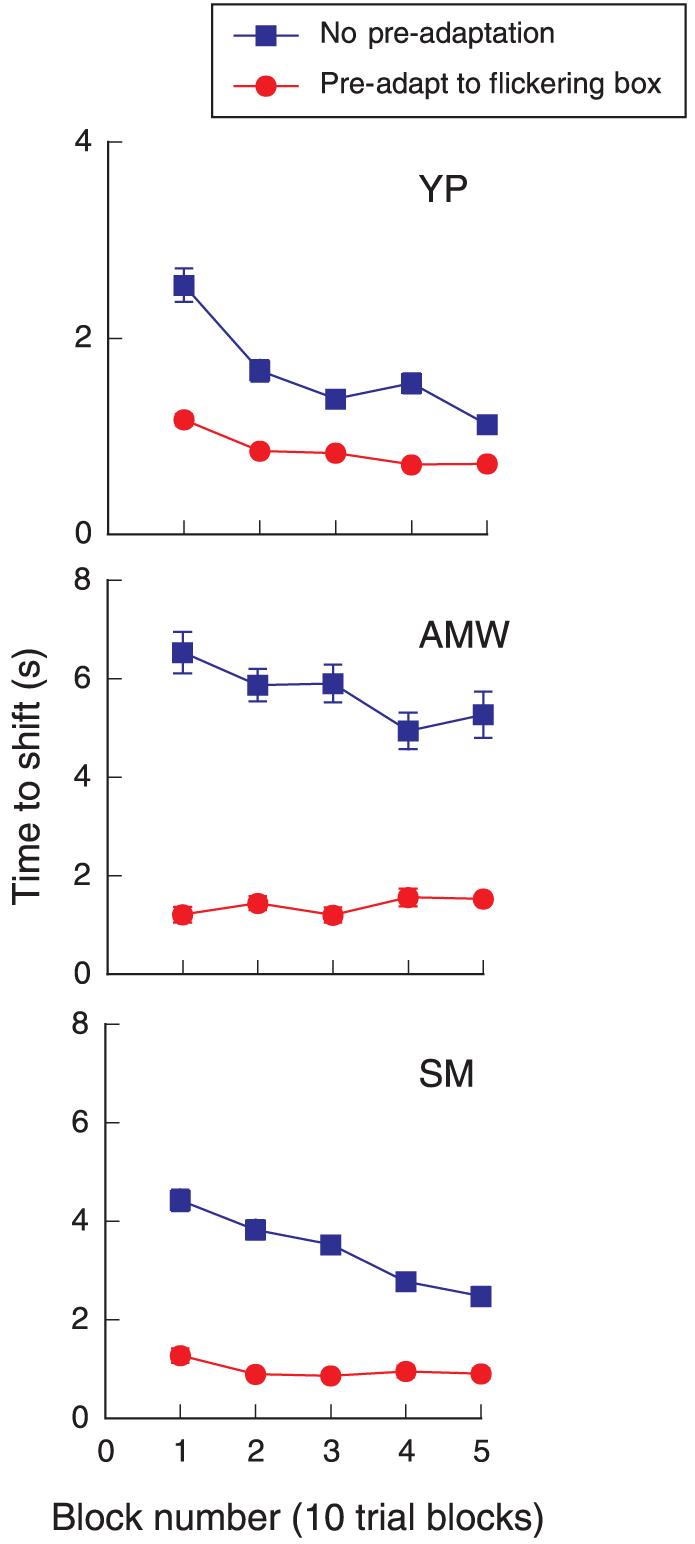
Figure 4.

Average time to shift for sequential blocks of 10 trials. The 3-cpd grating segment was 6° wide and 2° high and presented at 50% contrast. Blue squares: data taken from Figure 2; red circles: data for shift times after prolonged adaptation to large counter-phasing box of the same dimensions and disparity as test grating. Note scale differences between top and lower two graphs.
