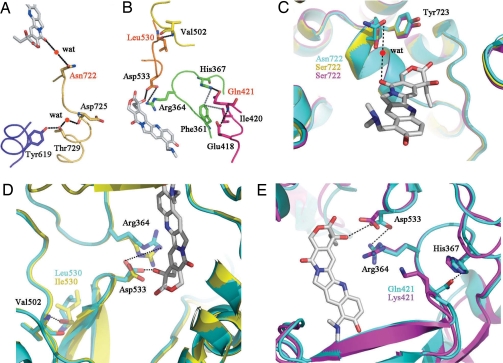
Fig. 4.
Schematic representation of the CPT-binding site in Top1. (A and B) Each chain of amino acid residues involved in CPT binding is shown in a different color. Hydrogen bonding or salt bridge interactions are indicated by black dotted lines, and van der Walls interactions are shown by gray dotted lines. Asn-722 forms a hydrogen bond via a water molecule (wat), and Asp-533 forms a direct contact with topotecan (shown in gray). Amino acid substitutions resulting in CPT resistance in CPT-producing plants are represented in red. (C) Superposition of the CPT-binding residue 722 of HsTop1 (blue) in a complex with topotecan and those of OpTop1 (yellow) and CaTop1 (magenta). (D and E) Superposition of the CPT-binding residue Asp-533 of HsTop1 (blue) and OpTop1 (yellow) (D) or CaTop1 (magenta) (E) by substitution Leu530Ile or Gln421Lys. Black dotted lines indicate hydrogen bonding in HsTop1, as indicated in A and B.

