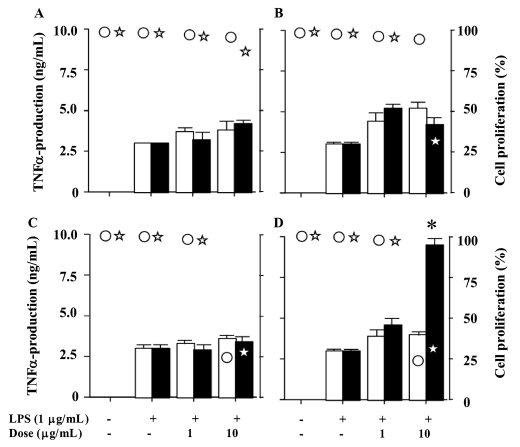
Figure 2. Effects of compounds 1–8 on TNF-α production and cell proliferation in LPS- stimulated RAW 264.7 cells.
Panels A, B, C, and D show the results of compounds 1 and 2, 3 and 4, 5 and 6, and 7 and 8, respectively. Open and solid bars represent lower and higher numbered compounds, respectively (* P < 0.05). Open circle and star represent lower and higher numbered compounds, respectively.

