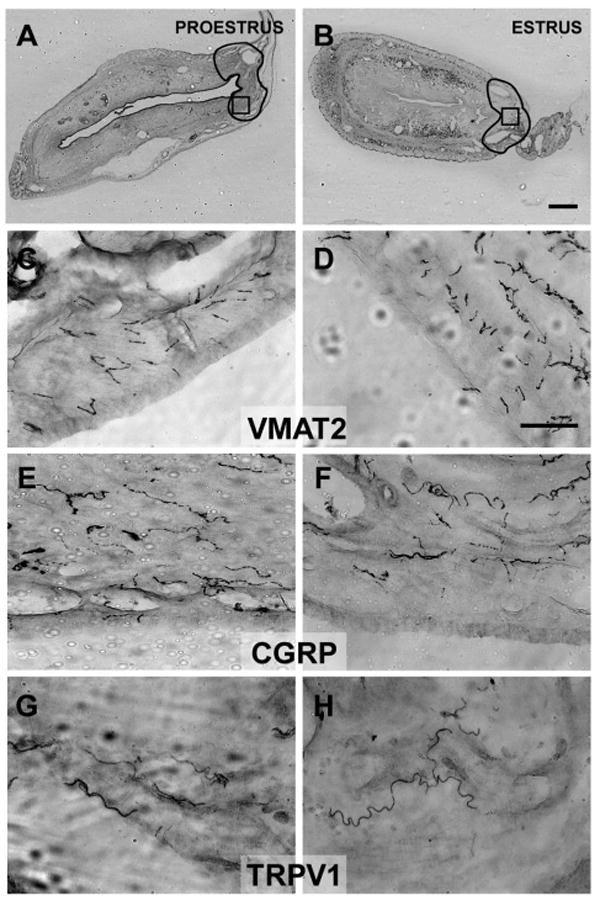
Fig. 3.

The regions outlined in A and B indicate an area in the uterine horn comparable to the hilus in the cysts (see Fig. 2, A and B), within which neurite labeling was counted (see Immunohistochemistry section in METHODS). The boxes in A and B (within the outlines) indicate the approximate regions where the higher-power photomicrographs (C–H) were taken. Photomicrographs of sections immunostained with antibodies for VMAT2 (C and D), CGRP (E and F), and TRPV1 (G and H) in the wall of the uterine horn in proestrus (left) or estrus (right). There were no proestrous-to-estrous differences in the density of neurite labeling for any of the markers. Calibration bar: 500 μm for A and B; 50 μm for C–H.
