
Fig. 2.
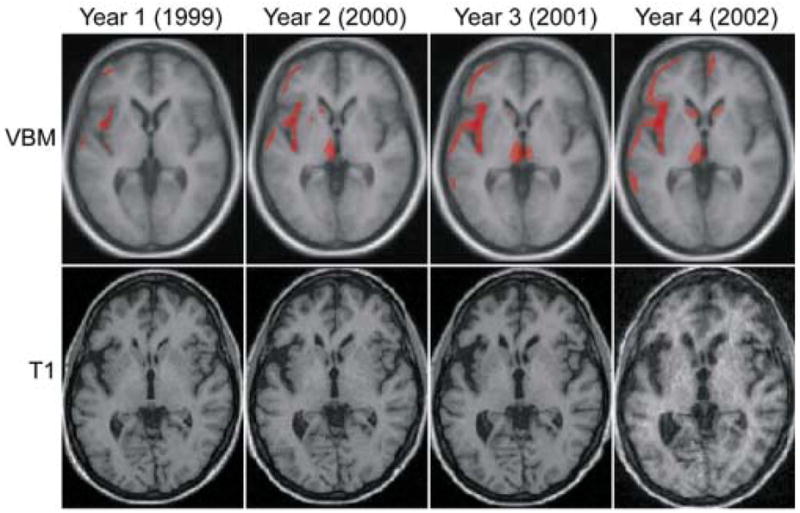
VBM results for the four annual scans of AS compared to controls. Scans were acquired in November or December of each year. The first line illustrates the VBM results thresholded at p < 0.005 uncorrected for multiple comparisons. The low level of significance was chosen to highlight the focality of the disease, even when a looser statistical threshold is applied. Areas of atrophied indicated in red are superimposed on axial sections (z = 0) of the mean image of all subjects used to create the template used for normalization. The second line shows AS’s original T1-weighted scans coregistered to show the same section as above.