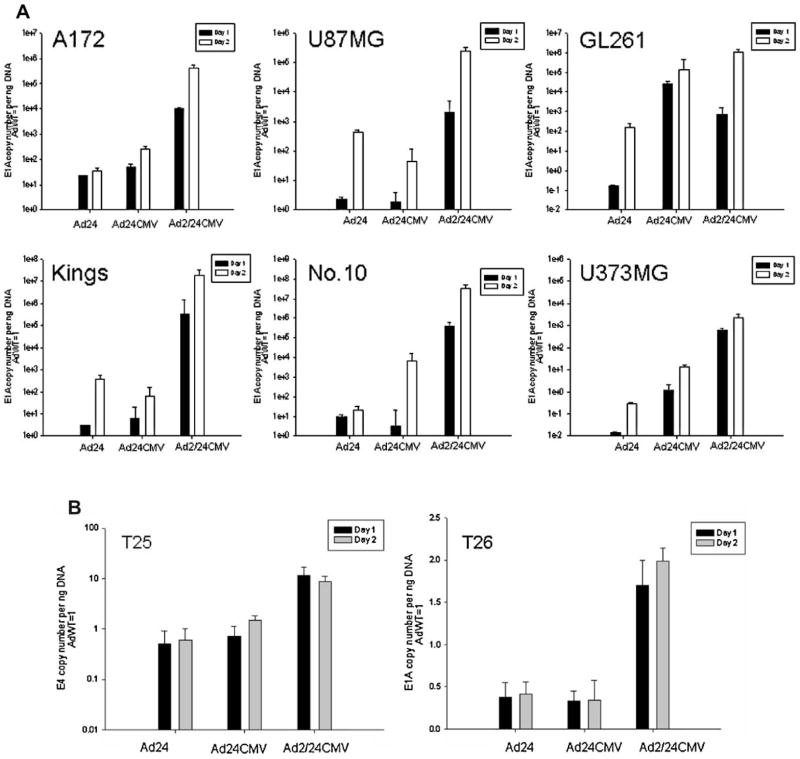
Fig. 4.
Analysis of viral replication in glioma. A: Human glioma cells U87MG, U373MG, A172, N.10, Kings, mouse glioma cells GL261, and (B) primary GBM tissue T25 and T26 were infected with AdWT, Ad24, Ad24CMV, and Ad2/24CMV viruses at a dose of 1,000 (A) and 500 (B) vp/cell. After 4 hr adsorption, cells were rinsed with PBS and allowed to continue incubation with growth media. Twenty-four and 48 hr after infection with each virus, replication activity was quantified by measuring the amount of E1A DNA copies/ng DNA by qPCR. Bar graphs represent fold change of E1A DNA copies/ng DNA over AdWT.

