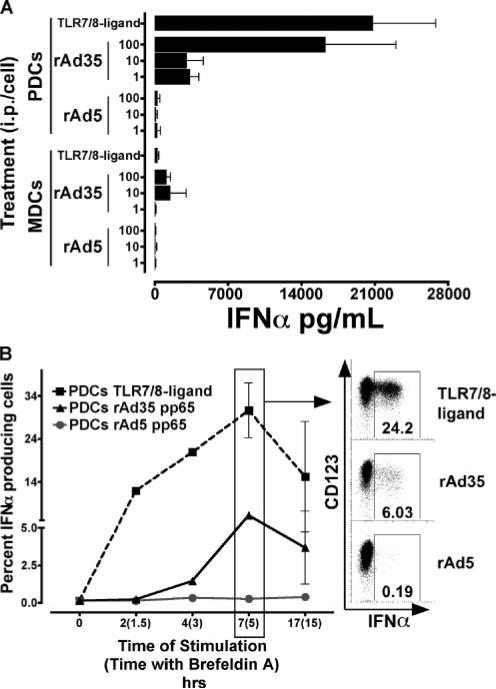
FIGURE 4.
Production of IFN-α induced by rAd35 but not rAd5. A, Supernatants were collected after 24 h of exposure to rAd5, rAd35, or TLR7/8 ligand and IFN-α production was analyzed by ELISA. Values reflect total IFN-α production (picograms per milliliter; mean ± SEM) at various doses of rAd5, rAd35 exposure, or TLR7/8 ligand stimulation. Exposure of rAd35, but not rAd5, induced high levels of IFN-α in PDCs and low levels in MDCs. B, PDCs were stained for intracellular IFN-α production after exposure of rAd5 or rAd35 or TLR7/8 ligand stimulation. Values are the percent of IFN-α-producing PDCs (mean ± SEM) over time indicating time including brefeldin A in parentheses. Stimulation of PDCs by TLR7/8 ligand (■) or rAd35 (▲) induced a similar kinetics pattern of rapid IFN-α production that peaks after 7 h, whereas intracellular IFN-α was nearly undetectable in PDCs following rAd5 (●) stimulation (n ≤ 3).

