
Figure 2.
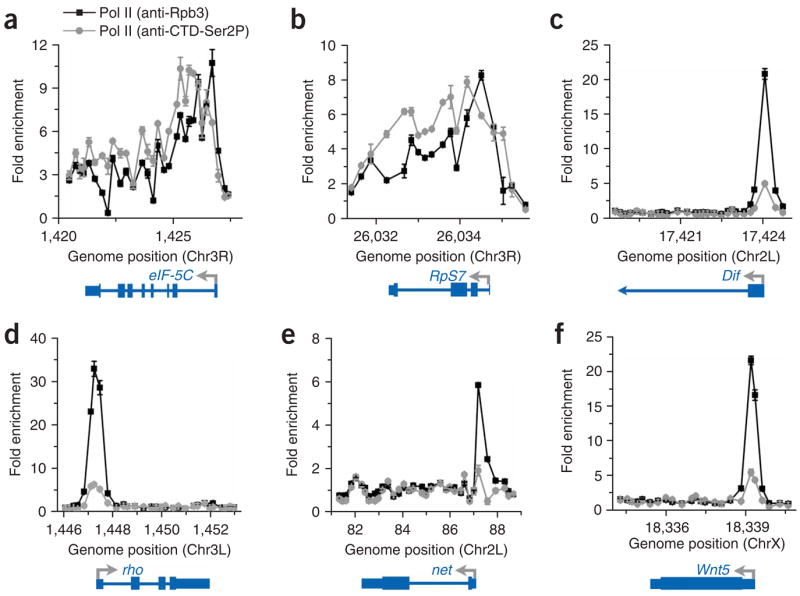
Pol II is enriched near the promoters of a subset of genes. ChIP-chip data for Pol II using antibodies that recognize the Rpb3 subunit (black squares) and the serine-2-phosphorylated CTD of Rpb1 (gray circles) are shown for six bound genes, plotted as fold enrichment over input versus chromosome position in kilobase units. The start site and direction of transcription are shown by arrows, with boxes depicting exons and lines representing introns. (a) eIF-5c (CG2922-RA). (b) RpS7 (CG1883-RA). (c) Dif (CG6794-RA). (d) rho (CG1004-RA). (e) net (CG11450-RA). (f) Wnt5 (CG6407-RA).