
Figure 3.
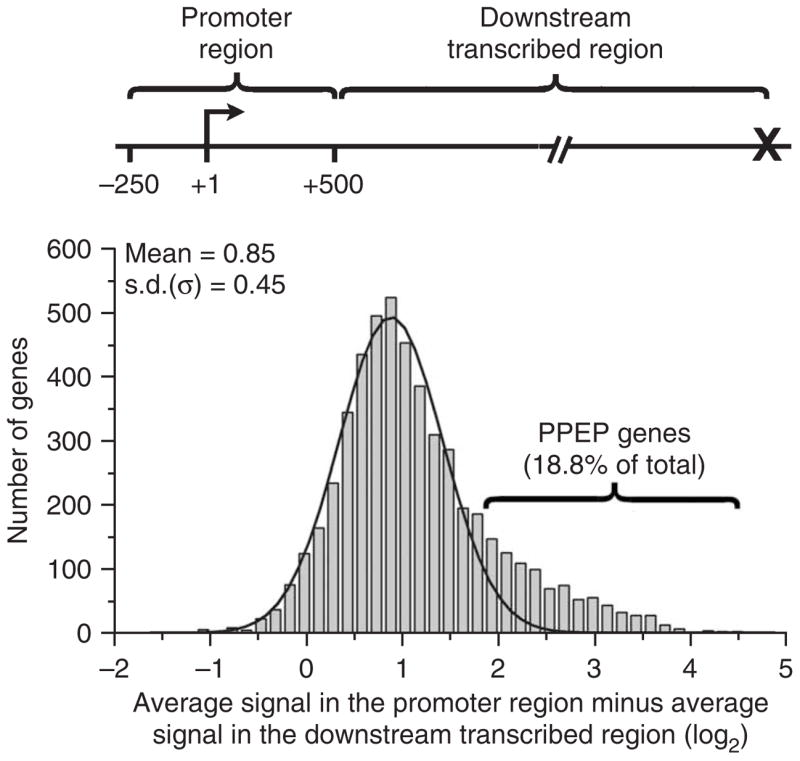
A subset of genes possess much more Pol II near their promoters than in the downstream region. The difference in average signal intensity (log2) in the promoter region (from −250 to +500 bp with respect to the transcription start site) and the downstream transcribed region (from +501 bp to the site of transcription termination) was determined. Shown is a histogram of these values for all bound genes, fit by a single Gaussian distribution. Calculating the difference between the average signals in log base 2 units is the equivalent of determining the ratio of fold enrichment in these regions; thus, a value of 1 on the x axis represents a twofold greater average Pol II signal near the promoter than downstream. A bracket designates the 1,014 genes with values >2 s.d. above the mean. These genes are defined as having promoter-proximal enrichment of polymerase (PPEP).