Abstract
Internal dynamics of proteins are usually characterized by the analysis of 15N relaxation rates that reflect the motions of NHN vectors. It was suggested a decade ago that additional information on backbone motions can be obtained by measuring cross-relaxation rates associated with intra-residue C′Cα vectors. Here we propose a new approach to such measurements, based on the observation of the transfer between two-spin orders and . This amounts to “anchoring” the and operators to the Nz term from the amide of the next residue. In combination with symmetrical reconversion, this method greatly reduces various artifacts. The experiment is carried out on human ubiquitin at 284.1 K, where the correlation time is 7.1 ns. The motions of the C′Cα vector appear more restricted than those of the NHN vector.
Introduction
The study of internal dynamics of proteins and nucleic acids by nuclear magnetic relaxation has been a very innovative and fruitful area of research over the past 15 years.1–3 In proteins, many probes have been used to characterize the motions of the backbone. Although most studies have focused on 15N nuclei,1,4 a variety of methods enable the measurement of relaxation properties of 13Cα and 13C′ nuclei, where C′ denotes the carbonyl carbon.5–7 Studies of 13Cα relaxation rates, which are comparable to those of amide 15N, revealed similar dynamic properties for both nuclei.5 Relaxation studies of 13C′ complemented the information obtained by 15N relaxation.6,7 Much effort has also been invested in the characterization of the dynamics of the C′Cα vector, either by measuring relaxation rates due to cross-correlated fluctuations between the C′ chemical shielding anisotropy (CSA) and the C′Cα dipolar coupling8 or by investigating auto-correlated dipolar cross-relaxation, also known as the nuclear Overhauser effect (NOE), σ(C′Cα).9,10 Two approaches have been described to measure the dipolar cross-relaxation rate σ(C′Cα), by observing either the transient NOE or the steady-state NOE. The latter experiment, along with cross-correlation measurements, was used to supplement the characterization of protein backbone dynamics by 15N relaxation.11 The transient experiment has been extended to sample side-chain dynamics.12 Several studies of the dynamics of the r(C′Cα) vector, employing various methods, have led to somewhat different interpretations.7,11,13–15
These results show that it is important to measure complementary relaxation rates to determine the amplitude and anisotropy of internal motions of peptide planes. The cross-relaxation rate σ(C′Cα) is particularly attractive for this purpose, since the C′Cαbond makes an angle of about 60° with respect to the NHN bond. Furthermore, uncertainties associated with the magnitudes and orientations of CSA tensors have no effect. Unfortunately, the measurement of steady-state effects9 on due to saturation of 13Cα suffers from systematic errors caused by other carbon nuclei, such as 13Cβ. The measurement of transient effects, as proposed by Cordier et al.,10 suffers from similar systematic errors, and the normalization of the transferred polarization is not fully satisfactory.
In this article, we present a new method to measure the dipolar cross-relaxation rate σ(C′Cα) that is much less prone to systematic errors. The measurement of the transient Overhauser effect between the two-spin orders and restricts the transfer to the one-bond cross-relaxation pathway. Moreover, symmetrical reconversion, a method that was initially developed in the context of cross-correlation experiments,16 allows one to normalize the transferred polarization.
Principle of the Experiment
The dipolar cross-relaxation rate σ(C′Cα) can be quantified either by monitoring the build-up of a transient polarization or by measuring a steady-state nuclear Overhauser effect upon saturation of one of the partners.17 Steady-state NOE methods are time-consuming because of the long saturation period required before each scan and the need for additional measurements of the C′ longitudinal relaxation rate. The 13Cα nuclei have to be saturated without affecting other nuclei, so that a compromise has to be chosen between a saturation that is either too selective or too broad. If some Cα’s are not completely saturated, the corresponding σ(C′Cα) rates will be underestimated. If the saturation is too broad, other carbons such as Cβ will be saturated, so that the σ(C′Cα) rates will be overestimated. Moreover, even if only the Cα’s are saturated perfectly, cross-relaxation with the Cα of the next residue, with a rate leads to an overestimation of the cross-relaxation rate by about 6%. These problems can be overcome by selecting a suitable network in transient NOE experiments.18 Figure 1 presents the geometry of the system and shows the cross-relaxation pathway that must be isolated and those that must be suppressed.
Figure 1.
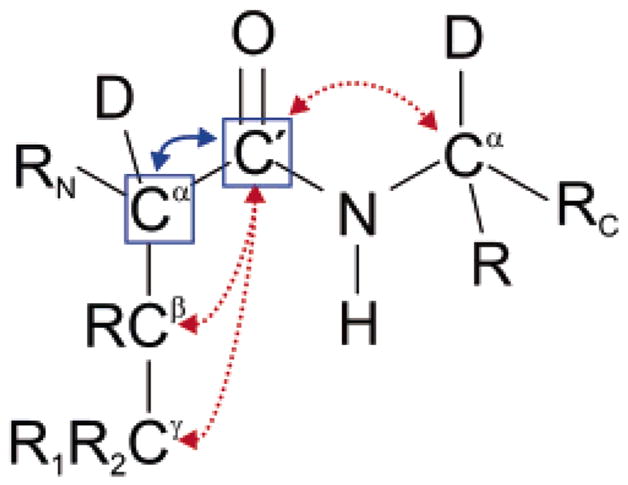
Representation of the system under investigation. The blue boxes highlight the 13C′ and 13Cα and 13Cα nuclei that carry the polarizations and . These are partly interchanged by the cross-relaxation rate σ(C′Cα) indicated by a solid blue arrow. This rate must be determined accurately to obtain a measure of local motions. Dotted red arrows show competing cross-relaxation pathways between the carbonyl 13C′, the intra-residue side chain nuclei 13Cβ and 13Cγ, as well as the 13Cα of the next residue.
The method of Cordier et al.10 – where the initial polarization of aliphatic protons is employed – fails to suppress the effects of cross-relaxation with and , unless an additional 13C chemical shift evolution period is inserted before the relaxation time. Moreover, it is difficult to normalize the signal intensities, and the experiment is not applicable to deuterated proteins. By starting from the amide proton instead of the aliphatic protons, it is possible to reduce significantly the amount of polarization at the beginning of the relaxation period: the upper value of 2J(C′Cβ) reported for ubiquitin19 (1.9 Hz) leads to a polarization transfer from C′ to Cβ of less than 1% during the refocused insensitive nuclei enhanced by polarization transfer (INEPT) sequence20 designed to transfer polarization from C′ to Cα. Combined with the low cross-relaxation rate, (about 5% of ), this effect may be safely neglected.
The problem caused by cross-relaxation between and still has to be solved. A way to discriminate between and would be to employ selective pulses. However, it would be very time-consuming to implement such an experiment if information is required for an entire protein. The approach we have chosen is to monitor the relaxation between the longitudinal two-spin orders, and . “Anchoring” the carbon operators to those of the amide nitrogen is an efficient way to design residue-specific experiments. Indeed, a perturbing cross-relaxation rate between and leads to an undesired conversion of the two-spin order operator to , which is then transferred by evolution under scalar coupling to . Since the scalar coupling is very small,19 the contribution of the latter operator to the observed signal will be negligible. This approach can be compared to those designed to suppress the observation of cross-relaxation from the amide protons.21,22 Since the INEPT transfer from Ni+1 to does not require refocusing, one does not need to insert two intervals (~33 ms) where the C′ single-quantum coherence evolves. This becomes important when transverse C′ relaxation by CSA is fast.
Two other issues are crucial for the quantitation of the transient C′Cα NOEs. First, the buildup signal has to be normalized. Second, the difference between the auto-relaxation rates and has to be determined to extract an accurate cross-relaxation rate from normalized buildup curves. These two issues can be solved by one and the same approach. Recently, a method called symmetrical reconversion was introduced for the measurement of transverse cross-correlation rates.16 In this article, this idea will be adapted to the measurement of auto-correlated longitudinal cross-relaxation rates.
The principle of the method, depicted in Figure 2, is to record four different experiments that correspond to all four relaxation pathways in a system comprising two spin operators. If AI and AIV are the amplitudes of the signals in the two auto-relaxation experiments (e.g., the decay of the and two spin orders) and AII and AIII the amplitudes recorded in the two cross-relaxation experiments (e.g., the transfer from to and vice versa), then
Figure 2.
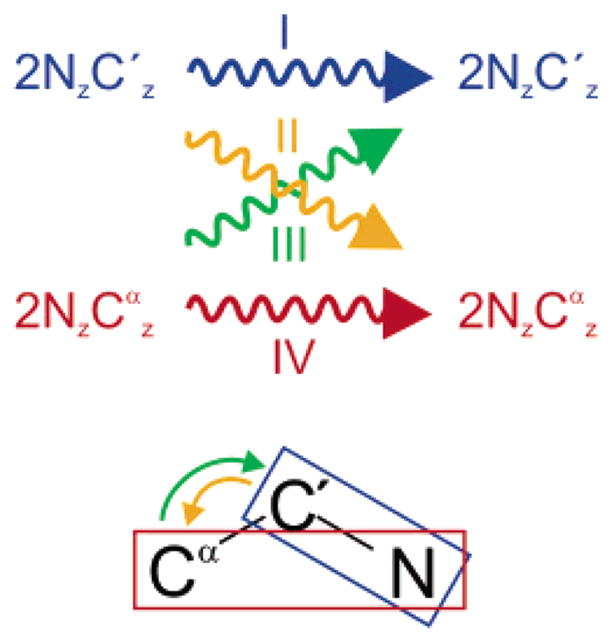
Schematic representation of the four experiments required to measure the cross-relaxation rate σ(C′Cα). In experiments I and IV, the auto-relaxation of the operators and (represented by blue and red rectangles, respectively) is measured, while the cross-relaxation from to and vice versa, which occurs with the rate σ(C′Cα), is measured in experiments II and III.
| (1) |
where T is the relaxation delay and ρCR the cross-relaxation rate which, as will be shown below, is an excellent approximation to the cross-relaxation rate between and . This relationship is exact even if the efficiencies of the preparation and reconversion steps are unknown, provided the auto-relaxation rates ρP and ρQ of the two operators and are identical.
Theory
In a system comprising two operators with different auto-relaxation rates, ρP and ρQ, the evolution of the operators P and Q is given by
| (2) |
This differential equation can be solved analytically:
| (3) |
where ch = cosh(ΣT), sh = sinh(ΣT), ρAV = (ρP + ρQ)/2, ΔQP = (ρQ − ρP)/2, and . The ratio of signal amplitudes defined in eq 1 can thus be expressed as
| (4) |
Note that there are only two unknown quantities, σCR and ΔQP, on the right-hand side of this equation. When ΣT ≪ 1 or , eq 4 simplifies to eq 1. Otherwise, ΔQP can be extracted from the ratio of the signal intensities of experiments IV and I:
| (5) |
where the constant C = 1 in the (unlikely) event that the efficiencies of the preparation and reconversion of the operators P and Q in experiments I and IV are equal. If this is not the case, one must record signal amplitudes for at least two relaxation delays T to extract σCR by simultaneously fitting eqs 4 and 5. Note that for ΣT ≪ 1, eq 5 does not depend on σCR.
The dipolar cross-relaxation rate is23,24
| (6) |
where , μ0 is the permeability of free space, ħ Planck’s constant divided by 2π, γC the gyromagnetic ratio of 13C nuclei, rCC the bond length, ωC the Larmor frequency for 13C, and J(ω) the spectral density function for the rotational motion of the internuclear vector. In a macromolecule with axially symmetric global tumbling tensor and with the assumptions of the model-free approach,25 J(ω) can be written as26,27
| (7) |
with A1 = (3 cos2 θ − 1)2/4, A2 = 3 sin2 θcos2 θ, A3 = 3/4 sin2θ, τ1 = (6D⊥)−1, τ2 = (D|| + 5D⊥)−1, τ3 = (4D|| + 2D⊥)−1, and ; S2 is the local order parameter, τe is the effective correlation time for the fast local motion, D|| and D⊥ are the rotational diffusion constants parallel and perpendicular to the symmetry axis of the diffusion tensor, and θ is the angle between this axis and the average orientation of the internuclear vector, r(C′Cα).
In a large macromolecule with very fast local motions, one has approximately
| (8) |
where can be computed from the structure and hydrodynamic properties of the macromolecule. In the case of isotropic rotational diffusion, is equal to the correlation time τc. The simple form of eq 8 makes σ(CαC′) a convenient probe of the local order parameter S2.
The cross-relaxation rate σCR between the operators and comprises two terms which have opposite signs in macromolecules:28
| (9) |
where δ(NC′NCα) is the relaxation rate originating from the cross-correlation of the 15N–13C′ and 15N–13Cα dipolar couplings. The expression for this rate is28
| (10) |
where d(NC′) = (μ0/4π)ĦγCγNr(NC′)−3, d(NCα) = (μ0/4π)ĦγCγNr(NCα)−3,γNis the gyromagnetic ratio of 15N, and r(NC′) and r(NCα) are the internuclear distances between the N nucleus and the C′ and Cα nuclei, respectively.
For isotropic global diffusion and isotropic local motion, the spectral density function may be written as29
| (11) |
where S2(NC′NCα) is the cross-correlation order parameter and Θ(NC′NCα) is the angle between the r(NC′) and r(NCα) internuclear vectors. In the absence of local motion, the order parameter is S2(NC′NCα) = [3 cos2[Θ(NC′NCα)] − 1]/2.28
Figure 3 presents the structural parameters employed to calculate the values of cross-relaxation rates in the five-spin system under investigation. The total rate σCR = σ(C′Cα) + δ(NC′NCα) differs from the desired rate σ(C′Cα) because of the perturbing term δ(NC′NCα). The ratio r = δ(NC′NCα)/σ(C′Cα) was calculated assuming isotropic local and global motions, so that the order parameters of all processes are affected equally. For a global correlation time τc, the ratio r is shown in Figure 4. As expected from the absence of a zero-frequency term in eq 10, the contribution of δ(NC′NCα) diminishes with increasing size. Clearly, |r| ≪ 1 in large macromolecules (τc > 10 ns) but should not be neglected in small proteins. Note that the ratio r shows little dependence upon variations of isotropic local dynamics. The desired cross-relaxation rate can be obtained as σ(C′Cα) = σCR/(1 + r).
Figure 3.

Interactions and parameters employed to calculate of the evolution of the 2N populations in a system with N = 5 spins. (a) Schematic representation of the interactions considered, with ellipses and dashed lines corresponding to CSA and relevant dipole–dipole (DD) interactions respectively. (b) Effective bond distances (in picometers) and (c) angles subtended between DD interactions.
Figure 4.
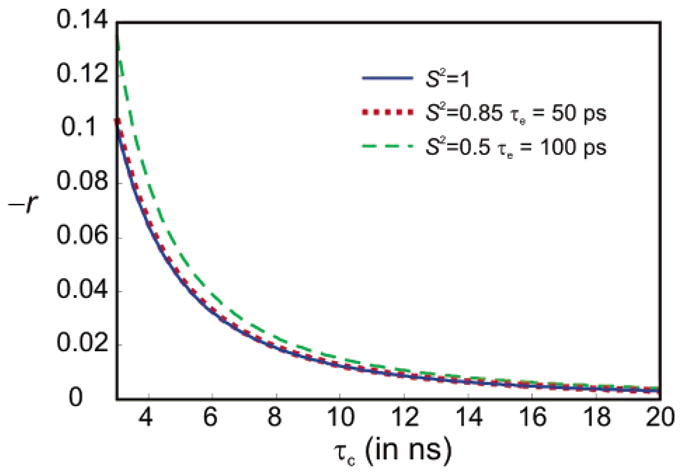
Ratio r = δ(NC′NCα)/σ(C′Cα) of the perturbing cross-correlation rate δ(NC′NCα) and the desired cross-relaxation rate σ(C′Cα), which together give the measured rate σCR = σ(C′Cα) + δ(NC′NCα) = (1 + r)σ(C′Cα), as a function of the overall tumbling correlation time τc. Calculations were carried out with eqs 6, 7, 10, and 11, assuming isotropic overall tumbling. Three different models of isotropic local dynamics were considered: rigid residues with S2 = 1 (solid blue line), typical residues with S2 = 0.85 and τe = 50 ps (dotted red line), and highly mobile residues with S2 = 0.5 and τe = 100 ps (dashed green line).
The apparent rate σCR can be contaminated by higher-order processes, which are due to multiple-step cross-relaxation and are proportional to Tn (n ≥ 2) rather than linear in T. These spin-diffusion processes may lead to deviations from the ideal relationship of eq 1. The evolution of the 2N populations in the system with N = 5 spins of Figure 3 was computed (in the base of all Zeeman operators and products thereof) with the interactions shown in Figure 3. Only the 5 strongest of the 10 possible dipole-dipole interactions were considered. The parameters employed for the CSA tensors are the averages obtained by Loth et al.29 for HN, C′, and N. For 13Cα and 13Cβ, we assumed the CSA to be δσ = 30 ppm and the symmetry axes of the tensors to lie along the r(CαHα) and r(CαCβ) vectors, respectively. The auto-relaxation rates were assumed to be , and R(Nz) = 1.5 s−1. For the product of any longitudinal operators A and B (single- or multiple-spin orders), we assumed that R(AB) = R(A) + R(B). Cross-relaxation rates were calculated for S2 = 1 and isotropic global diffusion (τc = 7 ns). As in the experiments, both 13Cα and 13C′ spins were inverted at t = T/4 and t = 3T/4, while the 15N and 1H spins were inverted at t = T/2. The calculations show that the deviations of the apparent rate (obtained from eq 1) from the relationship σCR = σ(C′Cα) + δ(NC′NCα) are below 0.3%, even for T = 800 ms. The deviations are mostly due to the difference δQP of eq 3. These deviations could thus be taken into account by eq 4. Note that the small dipolar coupling between N and Cα can safely be neglected in the calculations for second- and higher-order contributions. In contrast, the cross-correlated relaxation rate δ(NC′NCα) contributes to first order to σCR and has been taken into account with the ratio r of Figure 4.
Experimental Section
All experiments were run on a Bruker Avance 600 spectrometer, with a static field of 14.1 T, equipped with either (i) a triple-resonance TXI cryoprobe with a z-axis gradient for the measurement of σ(CαC′) or (ii) a triple-resonance TBI room-temperature probe with three-axis gradients for the measurement of 15N relaxation rates. A sample of uniformly triply labeled [2H,13C,15N]ubiquitin at a concentration of 1.5 mM in a H2O:D2O (90:10 v:v) buffer with 50 mM ammonium acetate (pH = 4.5) was used at a temperature of 284.1 K.
The pulse sequences used for the measurement of the cross-relaxation rate σCR are presented in detail in the Supporting Information. To improve both the amount of the proton polarization available at the beginning of each scan and the extent of water suppression,30 a water flip-back scheme was implemented with a WATERGATE sequence31 prior to acquisition. All carbon pulses were selective, except the initial purge pulses and the C′ pulses in the preparation and conversion of . The π/2 pulses were either Q5 Gaussian cascades32 or time-reversed Q5 pulses, depending on whether the operators are flipped toward or away from the transverse plane; all π pulses applied to C′ were Q3 pulses,32 whereas all π pulses applied to Cα were RE-BURP pulses.33
The 15N chemical shift labeling is performed using a constant-time evolution period. This can be changed to a semi-constant time scheme for systems that require a higher resolution in the 15N dimension. For each relaxation delay, the four experiments of symmetrical reconversion were interleaved, with 512 complex points in the 1H dimension and 60 complex points in the 15N dimension. Frequency-sign selection in the ω1 dimension was performed with the States method.34 Each free induction decay resulted from the sum of 64 scans. Every time point T required about 20 h of experimental time. The relaxation delays T were 400 (twice), 500, 600 (twice), 700, and 800 ms.
The rotational correlation time was determined with regular 15N R1, R2 and 15N{1H} steady-state NOE experiments35 as well as cross-correlated CSA(15N)/DD(15N1H) longitudinal36 ηz and transverse16 ηxy cross-relaxation rates. The relaxation delays employed were T = 15 (twice), 55, 105, 155, 205, 255 (twice), 305, 375, 505, and 655 ms for the R1 experiments as well as T = 2, 10, 20, 30 (twice), 40, 44, 50, 60, and 74 ms for the R2 experiments. The 1H saturation period was 6 s for the 15N{1H} NOE experiment. The mixing times were T = 100, 140, 180, and 220 ms for longitudinal and T = 60 and 80 ms for transverse CSA/DD cross-correlated relaxation rates.
The processing of the spectra was performed with NMRPIPE.37 The fit of peak intensities was performed with the nonlinear line shape analysis program nlinLS. Particular attention was paid to partially overlapping peaks. If a satisfying automated analysis could not be performed, the peaks were removed from further analysis. The symmetrical reconversion ratio of eq 1 was then used as input for the program curvefit.38
A potential source of error can be the nonideal behavior of the band-selective inversion of during the relaxation delay. First, an imperfect inversion may affect the apparent cross-relaxation between C′ and Cα. If one uses symmetrical reconversion, the loss of polarization due to incomplete inversion in the auto-relaxation experiment IV in Figure 2 is comparable to the product of the losses of intensity in the two cross-relaxation experiments II and III. Thus, this effect is expected to be negligible. Second, if is partially inverted unwittingly, cross-relaxation in the three-spin system {C′,Cα,Cβ}, with additional rates σ(CαCβ) and σ(C′Cβ), has to be evaluated. Since all cross-relaxation rates are much smaller than the auto-relaxation rates and , all relaxation delays T that yield sufficient signal intensity are in the initial linear regime of cross-relaxation. Therefore, second-order spin diffusion effects should be small. In the Supporting Information, numerical calculations show that both sources of errors can, indeed, be neglected.
Results and Discussion
Three examples of experimental buildup curves and best fits are presented in Figure 5. The quality of the data and corresponding fits is satisfactory for quantitative analysis. A high cross-relaxation rate σCR can be observed for the C′Cα pair of glutamine Q31, which is located in the α helix of ubiquitin, thus demonstrating the local rigidity of the secondary structure. The lower cross-relaxation rate for leucine L8 shows the well-documented flexibility of the turn between the first and second β strands.11,26 Arginine R74 is located in the very flexible C-terminal tail, which is reflected by the very low value of σCR.
Figure 5.
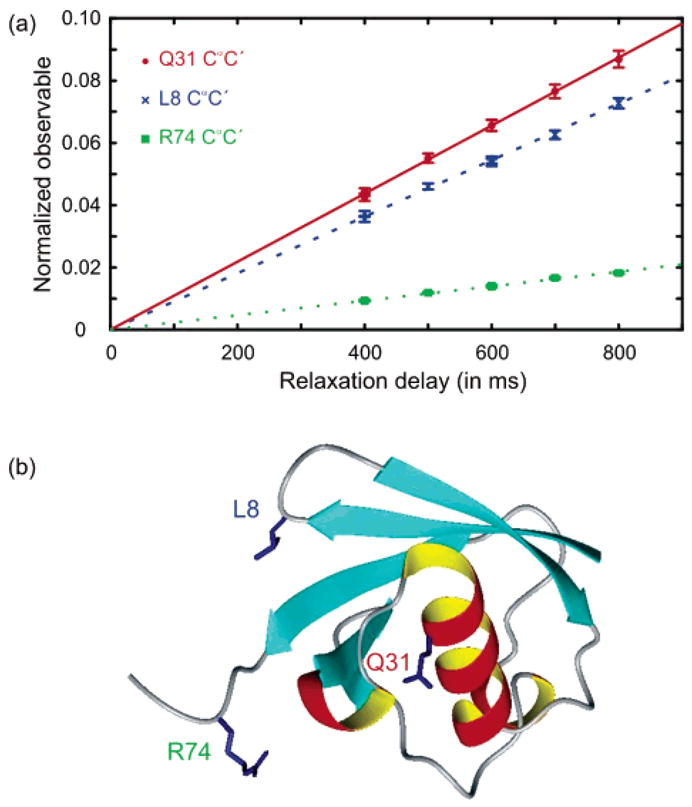
Three typical buildup curves of the symmetrical reconversion ratio of eq 1, with their best-fit curves and the structure of ubiquitin. Filled red circles and the solid red line correspond to the C′Cα pair of glutamine Q31 observed through the NHN pair of aspartate D32 (σCR = (10.9 ± 0.12 × 10⁻² s−1). Blue crosses and the dashed blue line correspond to the C′Cα pair of leucine L8 observed through the signal of threonine T9 (σCR = (9.07 ± 0.09) × 10−2 s−1). Filled green squares and the dotted green line correspond to the CαC′ pair of arginine R74 observed through the signal of glycine G75 (σCR = (2.33 × 0.02) × 10−2 s−1). The structure of ubiquitin39 was generated with MOLMOL.40
Figure 6 shows the corrected cross-relaxation rates σ(C′Cα) = σCR/(1 + r). The ratio r = δ(NC′NCα)/σ(C′Cα) was extracted from Figure 4 (assuming S2 = 1) using τc = 6.91 ns. This estimate was obtained from the largest measured value of σCR with eq 8, assuming S2 = 1. The isotropic correlation time obtained from 15N relaxation is τc = 7.11 ns. There is no significant difference in the values of r extracted using these two estimates of the isotropic correlation time. This shows that one does not need 15N relaxation data to extract σ(CαC′) from σCR. However, one should be careful if the overall motion is highly anisotropic or the entire molecule is floppy.
Figure 6.
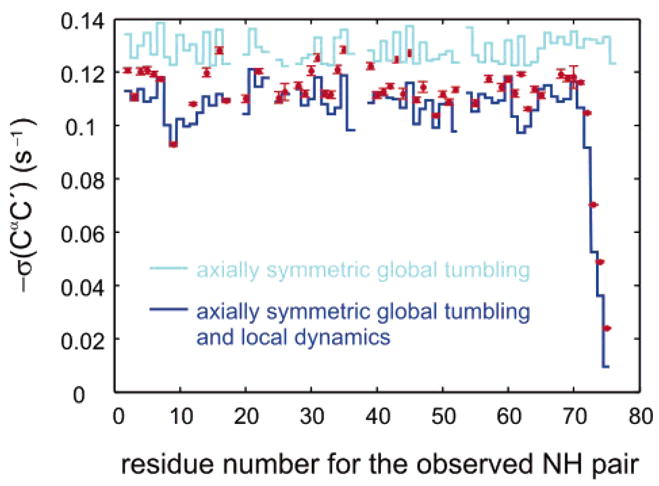
Dipolar cross-relaxation rates σ(C′Cα) for 53 residues of human ubiquitin. Red symbols represent corrected rates σ(C′Cα) = σCR/(1 + r). The light blue line corresponds to rates σ(C′Cα)rigid predicted using anisotropic global tumbling without local motions. The dark blue line incorporates the effects of isotropic local motions (residue-specific S2 and τe) obtained from 15N relaxation. For the last four residues, the extended model-free parameters were employed.41 Error bars indicate the 68% confidence limits.
The parameters describing the local motions of the vectors can be combined with the NMR structure of human ubiquitin42 to predict the motions of the vectors, assuming isotropic local motions of the entire peptide planes, so that S2 and τe are the same for both and vectors. Overall, the negative rates σ(C′Cα) predicted in this fashion have a slightly smaller amplitude than the experimental rates: the experimental average over residues 2–72 gives 〈σ(C′Cα)exp〉= −0.115 ± 0.001 s−1. This lies between the rate 〈σ(C′Cα)pred〉= −0.109 s−1 predicted if S2 and τe from 15N relaxation rates are used, and 〈σ(C′Cα)rigid〉= −0.129 s−1 if one assumes that S2 = 1. A few residues (e.g., T14, E16, G35, D39, L43, F45) show a significantly larger magnitude |σ(CαC′)| than predicted, but none of the rates is larger than predicted for the rigid case of S2 = 1.
Figure 7 shows the correlation of experimental order parameters S2(C′Cα) = σ(C′Cα)exp/σ(C′Cα)rigid with experimental order parameters S2(NHN) derived from 15N relaxation rates. The rates σ(C′Cα)rigid were predicted using parameters of global anisotropic motion derived from 15N relaxation rates, assuming S2 = 1, i.e., without local motions. The ratio S2(C′Cα) = σ(C′Cα)exp/σ(C′Cα)rigid corresponds to the one used in eq 7 for restricted local motions on fast time scales. To interpret these order parameters quantitatively, one needs to introduce a model for the local motions. One often describes anisotropic local motions of the peptide plane with the so-called axially symmetric three-dimensional Gaussian amplitude fluctuation (3D GAF) model,7 where motions around three orthogonal axes are characterized by the amplitudes σα = σβ = κσγ (σγ corresponds to fluctuations about the vector).
Figure 7.
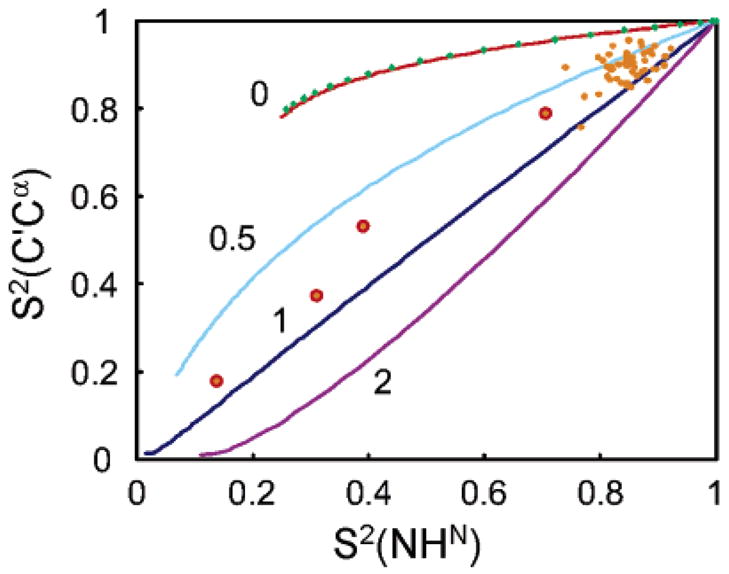
Orange dots: correlation of experimental order parameters S2(C′Cα) = σ(C′Cα)exp/σ(C′Cα)rigid with experimental order parameters S2(NHN) derived from 15N relaxation rates. The four points circled in red represent residues for which the extended model-free approach41 was used to fit 15N relaxation data. The curves show the theoretical correlation for the three-dimensional Gaussian amplitude fluctuation (3D GAF) model with amplitudes σα = σβ = κσγ (where σγ corresponds to fluctuations about the vectors) for κ = 0, 0.5, 1, and 2 (red, light blue, dark blue, and purple curves). The green diamonds (which are almost exactly on the red curve) represents S2{σCR} = aS2{σ(C′Cα)} + bS2{δ(NC′NCα)}/(a + b) for very anisotropic local motions (3 = 0, i.e., σα = σβ = 0) for weights a = 1 and b ) −0.12.
Theoretical curves are shown in Figure 7 for the 3D GAF model for κ = 0, 0.5, 1, and 2 (red, light blue, dark blue, and purple curves). In principle, unless the local motions are isotropic (κ = 1), it is not possible to separate the two contributions to the experimental rate σCR = σ(C′Cα) + δ(NC′NCα). Thus, one derives an apparent order parameter S2{σCR} = aS2{σ(C′Cα)} + bS2{δ(NC′NCα)}/(a + b). The order parameter S2{σCR} was calculated for very anisotropic local motions (κ = 0, i.e., σα = σβ = 0) and weights a = 1 and b = −0.12, which corresponds to a severe contamination, as can be seen in Figure 4. Results are displayed as the green diamonds which are almost exactly located on the red curve that represents S2{σ(C′Cα)}. The curves show that the order parameters S2{σ(C′Cα)} and S2{σCR} cannot be distinguished, even for a large local motional anisotropy (κ = 0) and an unusually large contribution of δ(NC′NCα). Thus, the ratio r = δ(NC′NCα)/σ(C′Cα) is sufficiently insensitive to the degree of anisotropy of local motion expressed by the parameter κ = σα/σγ= σβ/σγ in the GAF model, so that it is legitimate to extract σ(C′Cα) from σ(C′Cα) = σCR/(1 + r), and then to determine the order parameter S2{σ(C′Cα)}.
The dynamics of the four residues that belong to the C-terminal tail of ubiquitin and that exhibit large-amplitude motions cannot be described accurately by a simple model-free approach. The use of the extended model-free approach makes it difficult to compare the total order parameter41 to the 3D GAF-derived order parameters. Most of the remaining peptide planes show an order parameter S2(C′Cα) that is larger than S2(NHN). This indicates that the local motions cannot be accurately described by an isotropic model (κ = 1). In the axially symmetric 3D GAF model, the degree of anisotropy of the motions of the peptide plane is reflected by the ratio κ. Most experimental points lie between the curves corresponding to κ = 0.5 and κ = 1. None of the experimental points lies above the κ = 0 curve, which would be incompatible with the 3D GAF model. For comparison, the average value for κ obtained by Lienin et al.7 was 0.4 on ubiquitin at 300 K. However, this ratio, which suggests a more pronounced anisotropy than our results at 284.1 K, was critically dependent on the carbonyl CSA values employed. On the other hand, Wang et al.11 found values for S2(C′Cα) lower than S2(NHN) using either cross-correlated relaxation between the C′ CSA and the C′Cα dipolar coupling8 or C′Cα NOE measurements. However, recent results for ubiquitin using both 15N relaxation and 13C′ relaxation43 suggest that the NHN vectors sample a greater range of motions than the C′Cα vectors.
Residual dipolar couplings (RDC) are also sensitive to local dynamics. Ottiger and Bax13 have obtained effective bond lengths from RDC measurements in ubiquitin. The ratio between NHN and C′Cα bond lengths was found to be larger than the one usually assumed in relaxation studies. In this study, the local motions were considered to be isotropic. Bernado and Black-ledge14 have shown that the longer apparent NHN bond length could be explained by a 3D GAF model for the motions of the peptide plane. However, RDCs are also sensitive to motions on slower time scales,44–46 making it difficult to extract the parameters of the fast motion sampled by liquid-state relaxation studies.
Conclusion
We have presented a new method for the accurate measurement of the one-bond dipolar auto-correlated cross-relaxation rate between 13C′ and 13Cα nuclei in proteins. This rate gives a direct measure of the mobility of the C′Cα vector, which complements the standard 15N analysis. We refer to this method as COCA-NOE. The use of symmetrical reconversion and the anchoring of polarizations to the backbone 15N nucleus of the next residue (by the observation of the transfer between two-spin orders and ) circumvent artifacts of earlier methods. We have introduced a self-contained way to correct the observed rates by taking into account a small cross-correlated relaxation contribution to the measured rate. Other possible sources of systematic error are estimated to be negligible. Comparison of order parameters S2(C′Cα) extracted from our experiment with S2(NHN) obtained from 15N relaxation measurements shows that the local motion of the peptide plane is anisotropic and that the C′Cα vectors sample fewer motions than the NHN vector in ubiquitin.
Supplementary Material
Figures showing the details of the pulse sequences employed to measure the rate σ(CαC′); calculations of the effect of an imperfect inversion of the Cα spins during the relaxation delay; table with the corrected rates σ(CαC′) as well as the local dynamic parameters derived from 15N relaxation; orientation and magnitude of the global diffusion tensor derived from 15N relaxation; and MATLAB script employed to calculate high-order perturbations of the apparent cross-relaxation rate. This material is available free of charge via the Internet at http://pubs.acs.org.
Acknowledgments
We thank Prof. Arthur G. Palmer III (Columbia University) for fruitful discussions and Dr. Kaushik Dutta (NYSBC) for running some 15N relaxation experiments. F.F. and D.C. acknowledge support by grant GM 47021 from the National Institutes of Health. We thank the Centre National de la Recherche Scientifique (CNRS) and the Agence Nationale de la Recherche (ANR) for funding.
References
- 1.Palmer AG., III Chem Rev. 2004;104:3623–3640. doi: 10.1021/cr030413t. [DOI] [PubMed] [Google Scholar]
- 2.Kay LE. Nat Struct Biol. 1998;5:513–517. doi: 10.1038/755. [DOI] [PubMed] [Google Scholar]
- 3.Al-Hashimi HM. ChemBioChem. 2005;6:1506–1519. doi: 10.1002/cbic.200500002. [DOI] [PubMed] [Google Scholar]
- 4.Peng JW, Wagner G. Methods Enzymol. 1994;239:563–596. doi: 10.1016/s0076-6879(94)39022-3. [DOI] [PubMed] [Google Scholar]
- 5.LeMaster DM, Kushlan DM. J Am Chem Soc. 1996;118:9255–9264. [Google Scholar]
- 6.Dayie KT, Wagner G. J Am Chem Soc. 1997;119:7797–7806. [Google Scholar]
- 7.Lienin SF, Bremi T, Brutscher B, Brüschweiler R, Ernst RR. J Am Chem Soc. 1998;120:9870–9879. [Google Scholar]
- 8.Fischer MWF, Zeng L, Pang YX, Hu WD, Majumdar A, Zuiderweg ERP. J Am Chem Soc. 1997;119:12629–12642. [Google Scholar]
- 9.Zeng L, Fischer MWF, Zuiderweg ERP. J Biomol NMR. 1996;7:157–162. doi: 10.1007/BF00203826. [DOI] [PubMed] [Google Scholar]
- 10.Cordier F, Brutscher B, Marion D. J Biomol NMR. 1996;7:163–168. doi: 10.1007/BF00203827. [DOI] [PubMed] [Google Scholar]
- 11.Wang TZ, Cai S, Zuiderweg ERP. J Am Chem Soc. 2003;125:8639–8643. doi: 10.1021/ja034077+. [DOI] [PubMed] [Google Scholar]
- 12.Houben K, Boelens R. J Biomol NMR. 2004;29:151–166. doi: 10.1023/B:JNMR.0000019246.13356.ff. [DOI] [PubMed] [Google Scholar]
- 13.Ottiger M, Bax A. J Am Chem Soc. 1998;120:12334–12341. [Google Scholar]
- 14.Bernado P, Blackledge M. J Am Chem Soc. 2004;126:4907–4920. doi: 10.1021/ja036977w. [DOI] [PubMed] [Google Scholar]
- 15.Chang SL, Tjandra N. J Magn Reson. 2005;174:43–53. doi: 10.1016/j.jmr.2005.01.008. [DOI] [PubMed] [Google Scholar]
- 16.Pelupessy P, Espallargas GM, Bodenhausen G. J Magn Reson. 2003;161:258–264. doi: 10.1016/s1090-7807(02)00190-8. [DOI] [PubMed] [Google Scholar]
- 17.Neuhaus D, Williamson MP. The Nuclear Overhauser Effect in Structural and Conformational Analysis. 2. John Wiley & Sons; New York: 2000. [Google Scholar]
- 18.Zwahlen C, Vincent SJF, Di Bari L, Levitt MH, Bodenhausen G. J Am Chem Soc. 1994;116:362–368. [Google Scholar]
- 19.Hu JS, Bax A. J Am Chem Soc. 1997;119:6360–6368. [Google Scholar]
- 20.Burum DP, Ernst RR. J Magn Reson. 1980;39:163–168. [Google Scholar]
- 21.Wu JH, Fan JS, Pascal SM, Yang DW. J Am Chem Soc. 2004;126:15018–15019. doi: 10.1021/ja045300l. [DOI] [PubMed] [Google Scholar]
- 22.Eichmuller C, Skrynnikov NR. J Biomol NMR. 2005;32:281–293. doi: 10.1007/s10858-005-0658-y. [DOI] [PubMed] [Google Scholar]
- 23.Abragam A. Principles of Nuclear Magnetism. Oxford University Press; Oxford: 1961. [Google Scholar]
- 24.Cavanagh J, Fairbrother WJ, Palmer AG, III, Skelton NJ. Protein NMR Spectroscopy: Principles and Practice. Academic Press; New York: 1996. [Google Scholar]
- 25.Lipari G, Szabo A. J Am Chem Soc. 1982;104:4546–4559. [Google Scholar]
- 26.Tjandra N, Feller SE, Pastor RW, Bax A. J Am Chem Soc. 1995;117:12562–12566. [Google Scholar]
- 27.Kroenke CD, Loria JP, Lee LK, Rance M, Palmer AG., III J Am Chem Soc. 1998;120:7905–7915. [Google Scholar]
- 28.Kumar A, Grace RCR, Madhu PK. Prog Nucl Magn Reson Spectrosc. 2000;37:191–319. [Google Scholar]
- 29.Loth K, Pelupessy P, Bodenhausen G. J Am Chem Soc. 2005;127:6062–6068. doi: 10.1021/ja042863o. [DOI] [PubMed] [Google Scholar]
- 30.Grzesiek S, Bax A. J Am Chem Soc. 1993;115:12593–12594. [Google Scholar]
- 31.Piotto M, Saudek V, Sklenar V. J Biomol NMR. 1992;2:661–665. doi: 10.1007/BF02192855. [DOI] [PubMed] [Google Scholar]
- 32.Emsley L, Bodenhausen G. Chem Phys Lett. 1990;165:469–476. [Google Scholar]
- 33.Geen H, Freeman R. J Magn Reson. 1991;93:93–141. [Google Scholar]
- 34.States DJ, Haberkorn RA, Ruben DJ. J Magn Reson. 1982;48:286–292. [Google Scholar]
- 35.Kay LE, Torchia DA, Bax A. Biochemistry. 1989;28:8972–8979. doi: 10.1021/bi00449a003. [DOI] [PubMed] [Google Scholar]
- 36.Pelupessy P, Ferrage F, Chassagneux Y, Bodenhausen G. manuscript in preparation. [Google Scholar]
- 37.Delaglio F, Grzesiek S, Vuister GW, Zhu G, Pfeifer J, Bax A. J Biomol NMR. 1995;6:277–293. doi: 10.1007/BF00197809. [DOI] [PubMed] [Google Scholar]
- 38.Palmer AG., III http://www.palmer.hs.columbia.edu.
- 39.Vijay-Kumar S, Bugg CE, Cook WJ. J Mol Biol. 1987;194:531–544. doi: 10.1016/0022-2836(87)90679-6. [DOI] [PubMed] [Google Scholar]
- 40.Koradi R, Billeter M, Wuthrich K. J Mol Graph. 1996;14:51. doi: 10.1016/0263-7855(96)00009-4. [DOI] [PubMed] [Google Scholar]
- 41.Clore GM, Szabo A, Bax A, Kay LE, Driscoll PC, Gronenborn AM. J Am Chem Soc. 1990;112:4989–4991. [Google Scholar]
- 42.Cornilescu G, Marquardt JL, Ottiger M, Bax A. J Am Chem Soc. 1998;120:6836–6837. [Google Scholar]
- 43.Zuiderweg ERP. personal communication. 2006.
- 44.Lakomek NA, Carlomagno T, Becker S, Griesinger C, Meiler J. J Biomol NMR. 2006;34:101–115. doi: 10.1007/s10858-005-5686-0. [DOI] [PubMed] [Google Scholar]
- 45.Tolman JR. J Am Chem Soc. 2002;124:12020–12030. doi: 10.1021/ja0261123. [DOI] [PubMed] [Google Scholar]
- 46.Bouvignies G, Bernado P, Meier S, Cho K, Grzesiek S, Bruschweiler R, Blackledge M. Proc Natl Acad Sci USA. 2005;102:13885–13890. doi: 10.1073/pnas.0505129102. [DOI] [PMC free article] [PubMed] [Google Scholar]
Associated Data
This section collects any data citations, data availability statements, or supplementary materials included in this article.
Supplementary Materials
Figures showing the details of the pulse sequences employed to measure the rate σ(CαC′); calculations of the effect of an imperfect inversion of the Cα spins during the relaxation delay; table with the corrected rates σ(CαC′) as well as the local dynamic parameters derived from 15N relaxation; orientation and magnitude of the global diffusion tensor derived from 15N relaxation; and MATLAB script employed to calculate high-order perturbations of the apparent cross-relaxation rate. This material is available free of charge via the Internet at http://pubs.acs.org.


