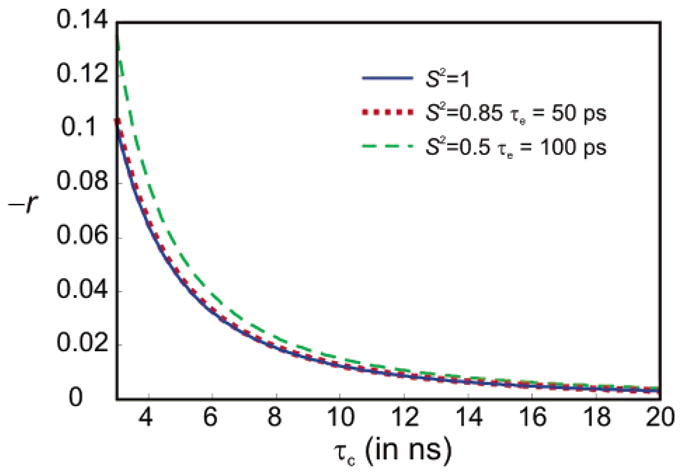
Figure 4.

Ratio r = δ(NC′NCα)/σ(C′Cα) of the perturbing cross-correlation rate δ(NC′NCα) and the desired cross-relaxation rate σ(C′Cα), which together give the measured rate σCR = σ(C′Cα) + δ(NC′NCα) = (1 + r)σ(C′Cα), as a function of the overall tumbling correlation time τc. Calculations were carried out with eqs 6, 7, 10, and 11, assuming isotropic overall tumbling. Three different models of isotropic local dynamics were considered: rigid residues with S2 = 1 (solid blue line), typical residues with S2 = 0.85 and τe = 50 ps (dotted red line), and highly mobile residues with S2 = 0.5 and τe = 100 ps (dashed green line).
