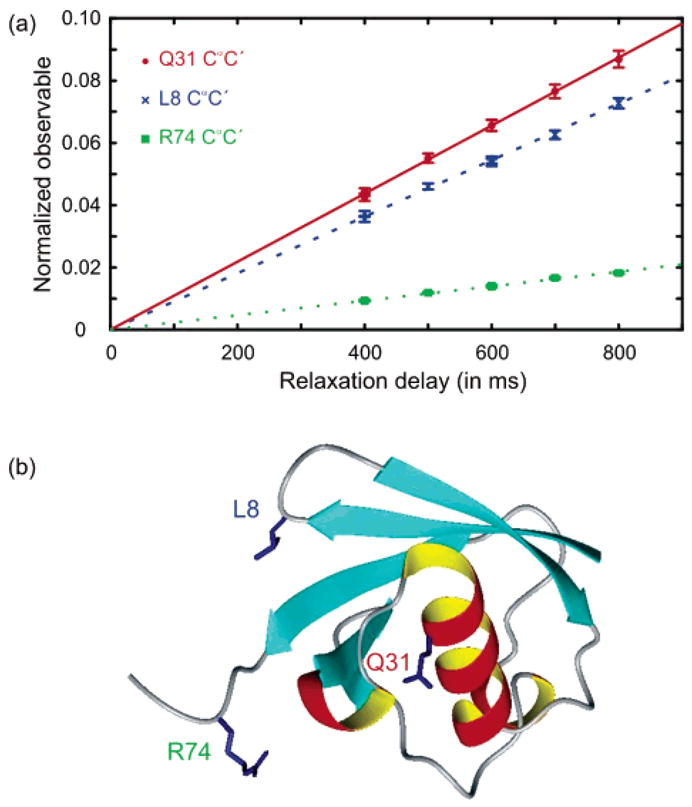
Figure 5.

Three typical buildup curves of the symmetrical reconversion ratio of eq 1, with their best-fit curves and the structure of ubiquitin. Filled red circles and the solid red line correspond to the C′Cα pair of glutamine Q31 observed through the NHN pair of aspartate D32 (σCR = (10.9 ± 0.12 × 10⁻² s−1). Blue crosses and the dashed blue line correspond to the C′Cα pair of leucine L8 observed through the signal of threonine T9 (σCR = (9.07 ± 0.09) × 10−2 s−1). Filled green squares and the dotted green line correspond to the CαC′ pair of arginine R74 observed through the signal of glycine G75 (σCR = (2.33 × 0.02) × 10−2 s−1). The structure of ubiquitin39 was generated with MOLMOL.40
