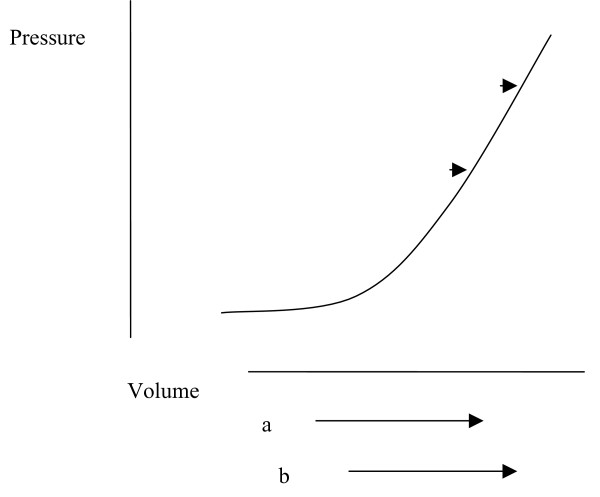
Figure 3.
Hypothetical graph showing the change in spinal volume and pressure with movement and a space-occupying lesion. Lines a and b represent volume fluctuation with movement, with 'a' representing the normal range and 'b' the range with an uncompensated space occupying lesion. Points 'a' and 'b' on the curve indicate maximal CSF pressures that occur with maximal venous volume.

