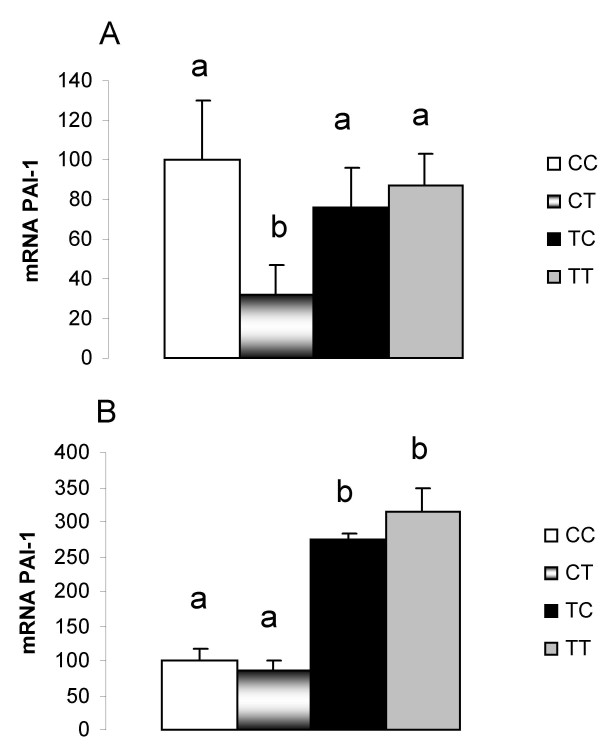
Figure 4.
PAI-1 mRNA quantification in (A) retroperitoneal and (B) epididymal white adipose tissues. CC, mothers fed C diet and offspring fed C diet; CT, mothers fed C diet and offspring fed T diet; TT, mothers fed T diet and offspring fed T diet; TC, mothers fed T diet and offspring fed C diet. Data are means ± SE of six determinations per group. Results are expressed in arbitrary units, stipulating 100 as the control value. p < 0.05.

