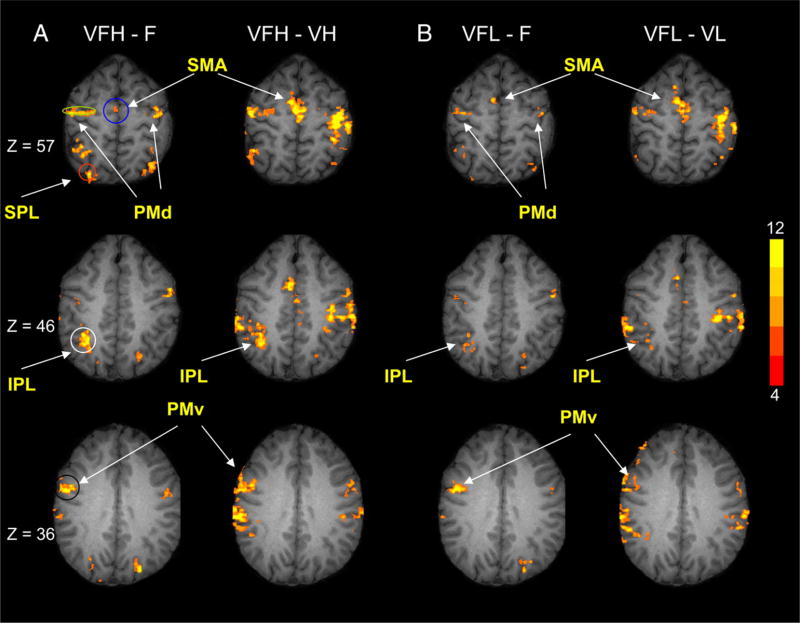
FIG. 4.
Group map activation in the parietal cortex and premotor cortex. A: VFH-F and VFH-VH comparisons; B: VFL-F and VFL-VL comparisons. The VFH-F and VFH-VH comparisons were used to identify visuomotor ROIs. The VFL-F and VFL-VL comparisons are depicted for visual comparisons with the VFH condition. For each image, the group map activation from the Fisher test was overlaid onto a single subject anatomical image. Z slices are shown at 57, 46, and 36 mm (MNI space). The ROIs included SMA (blue), PMd (green), PMv (black), IPL (white), and SPL (red).

