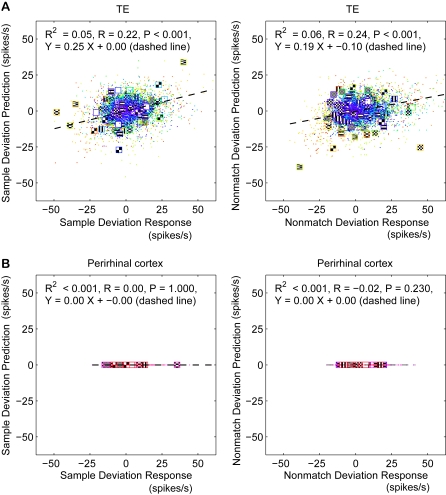
Figure 6. Predictions of response deviations by the deterministic model simulation.
(A, B) Predictions of the deviations for TE (A) and perirhinal (B) neurons. Left column shows predictions of the deviations from the mean in the sample responses compared to the actual sample response deviations. Right column shows predictions for nonmatch response deviations. Variance explained is low in TE, but zero for perirhinal, which is a rough match to our data. (Format as in Figure 5.)

