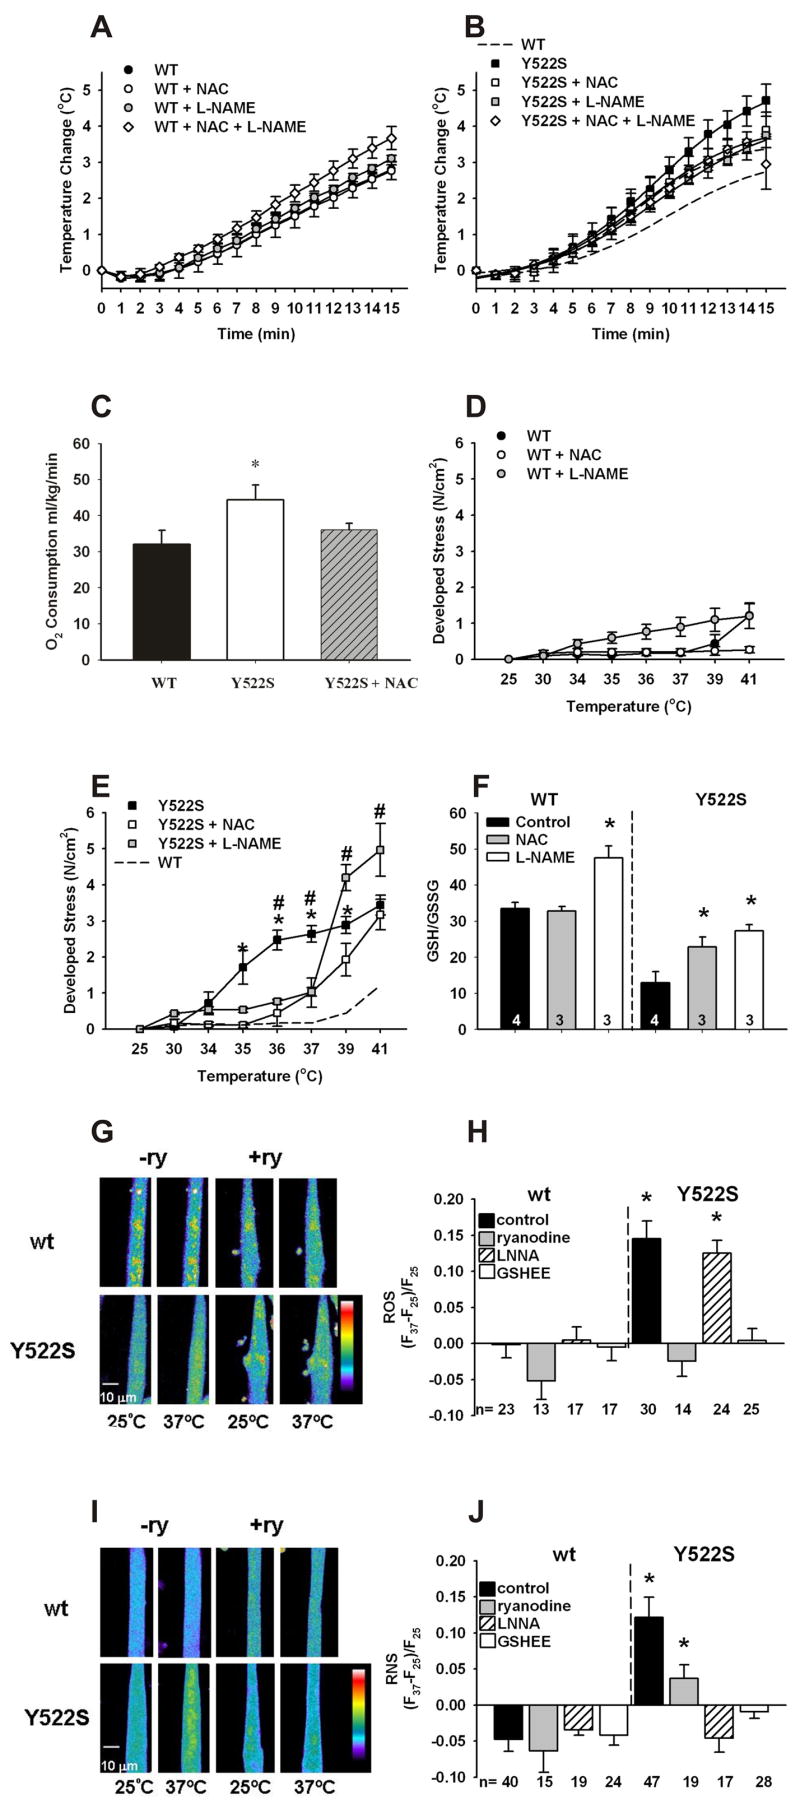
Figure 1. Effects of warming on RyR1Y522S/wt mice.

A. Rectal temperatures in RyR1wt/wt mice. Mice were anesthetized with etomidate (i.p.) and placed in an environmental chamber (41°C) and rectal temperatures were measured as a function of time in RyR1wt/wt mice (●, n=10) and in mice treated for 3–5 days with NAC (○, n=6), L-NAME (gray circles, n=4) or combined NAC and L-NAME (◇, n=4). B. Rectal temperatures in RyR1Y522S/wt mice. Similar measurements were made with RyR1Y522S/wt mice (■, n=7) and mice treated with NAC (□, n=4), L-NAME (gray squares, n=4), and combined NAC and L-NAME (◇, n=4). The dashed line represents the WT curve from Figure 1A for comparison. When the curves were compared by F-tests, NAC (p<0.05), L-NAME (p<0.001) and NAC + L-NAME (p<0.001) significantly attenuated the response versus no treatment in the RyR1Y522S/wt mice. C. VO2 is increased at thermoneutral conditions in RyR1Y522S/wt mice. VO2 was measured at 32°C using 4–5 mice in each group *p<0.05 vs. RyR1wt/wt. D. Temperature sensitivity of basal stress in RyR1wt/wtsolei. Solei from RyR1wt/wt (with and without prior treatment with NAC or L-NAME) were isolated, attached to force transducers, and heated progressively from an initial temperature of 25°C to 41°C. n=3–8 mice/group. E. Temperature sensitivity of basal stress in RyR1Y522S/wt solei. Group, temperature, and interaction effects were significant (p<0.0001) when data were analyzed by 2-way ANOVA. *p<0.05 to p<0.001 RyR1Y522S/wt vs RyR1Y522S/wt NAC, #p<0.05 to p<0.01 RyR1Y522S/wt vs. RyR1Y522S/wt L-NAME. For clarity, significant differences between L-NAME and NAC treated groups at 39°C and 41°C are not indicated on the graph. F. GSH/GSSG ratios. The data (n=3–4) were compared between untreated mice of each genotype and the mice receiving the indicated treatment. *p<0.05. G. Fluorescence imaging of myotubes loaded with DCF. All imaging data were obtained from multiple cells across at least three independent myotube preparations. Representative images obtained with DCF-loaded RyR1wt/wt and RyR1Y522S/wt myotubes at 25ºC and 37ºC in the presence and absence of ryanodine (20 μM). H. Changes in DCF fluorescence with temperature. ROS production was detected with DCF in the presence absence of ryanodine (20μM), L-NNA (50 μM) and GSHEE (5mM). I. Fluorescence imaging of myotubes loaded with DAF-AM. Representative images obtained with DAF-AM loaded RyR1wt/wt and RyR1Y522S/wt myotubes at 25ºC and 37ºC in the presence and absence of ryanodine (20 μM). J. Changes in DAF fluorescence with temperature. RNS production was detected with DAF in the presence or absence of ryanodine (20μM), L-NNA (50 μM) and GSHEE (5mM). All data in this figure are shown as mean ± S.E.M.
