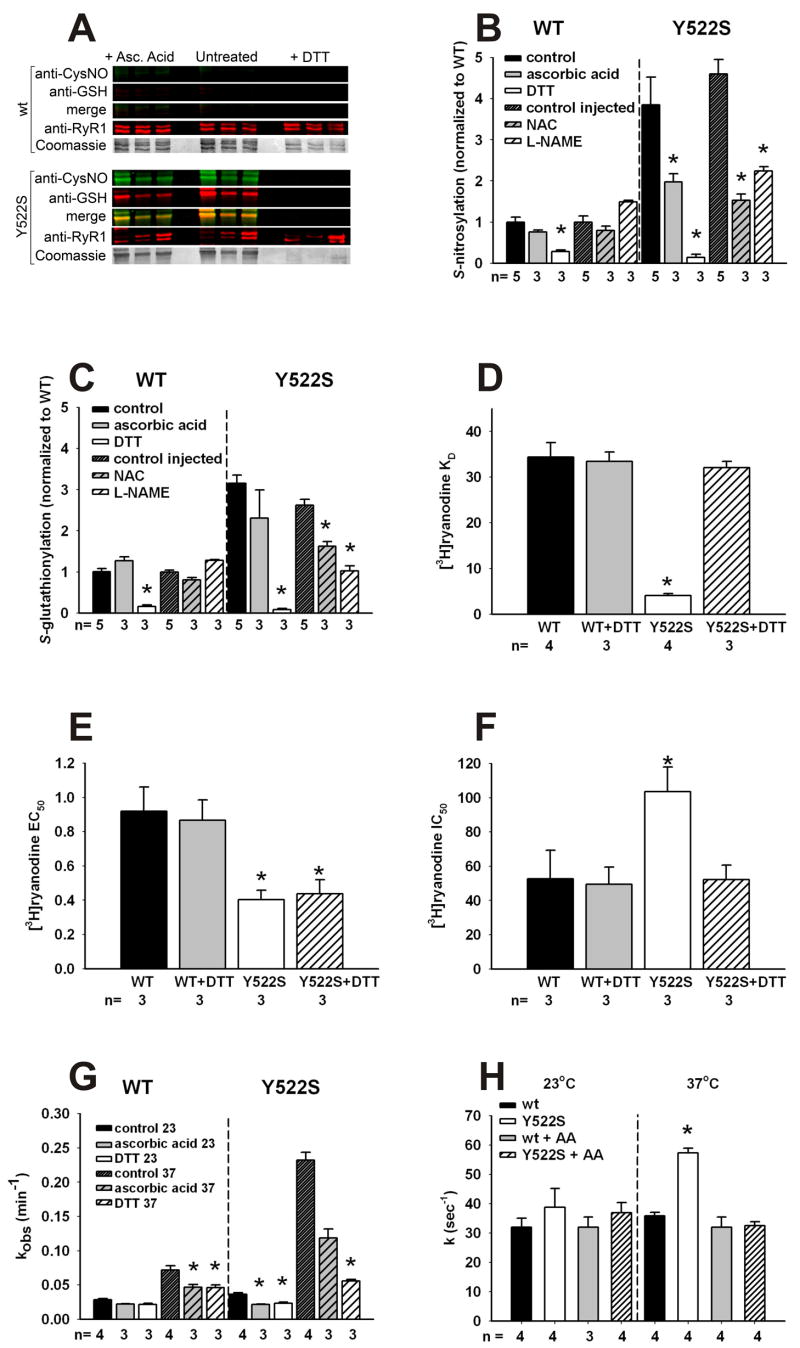
Figure 3. Redox modifications of RyR1 and functional consequences.
A. Redox modifications of RyR1. Representative blots obtained with 3 independent microsomal preparations were obtained from RyR1wt/wt (top) and RyR1Y522S/wt (bottom) mice. Density of the bands corresponding to the redox modifications of RyR1 were obtained under control conditions (middle) or in the presence of either ascorbic acid (left) or DTT (right). B. Fluorescence signals for S-nitrosylation normalized to the Coomassie stain of each band. Data (mean ± SD, n=3–5) are presented as the ratio to untreated microsomes. *p<0.05 compared to control. C. Fluorescence signals for S-glutathionylation normalized to the Coomassie stain of each band. Data (mean ± SD, n=3–5) are presented as the ratio to untreated microsomes. *p<0.05 compared to control. D–F. Equilibrium [3H]ryanodine binding. Scatchard plot analysis (see Supplemental Figure 4) determination of KD values for [3H]ryanodine binding to microsomes from RyR1wt/wt and RyR1Y522S/wt muscle (D). [3H]ryanodine binding was titrated at different Ca2+concentrations to calculate EC50 (E) and IC50 (F) values from traces as those shown in Supplemental Figure 5. *p<0.05 compared to RyR1wt/wt or untreated controls. G. Temperature dependence of the association kinetics of [3H]ryanodine binding. Microsomes from untreated mice were pre-incubated in vitro with buffer (untreated), AA or DTT as in (A). [3H]ryanodine binding was assessed at different time points (1–90min) and kobs values (mean ± SD) were determined from 3–4 independent experiments. Statistical significance for all panels was obtained by two-way ANOVA. *p<0.05 compared to RyR1wt/wt or untreated controls. H. Rate of Ca2+ efflux from SR vesicles. Ca2+-induced Ca2+ release in the presence of 1mM free ATP and 9–10 μM free Ca2+ was measured using stopped-flow spectrofluorometry. Ca2+ release was measured in RyR1wt/wt and RyR1Y522S/wt vesicles using extravesicular Calcium Green-5N under control conditions or following treatment with AA. Release rate constant values (k) were obtained by peak differential analysis of fluorescence data (representative traces shown in Supplemental Figure 7). All data in this figure are shown as mean ± S.E.M.

