
Fig. 5.
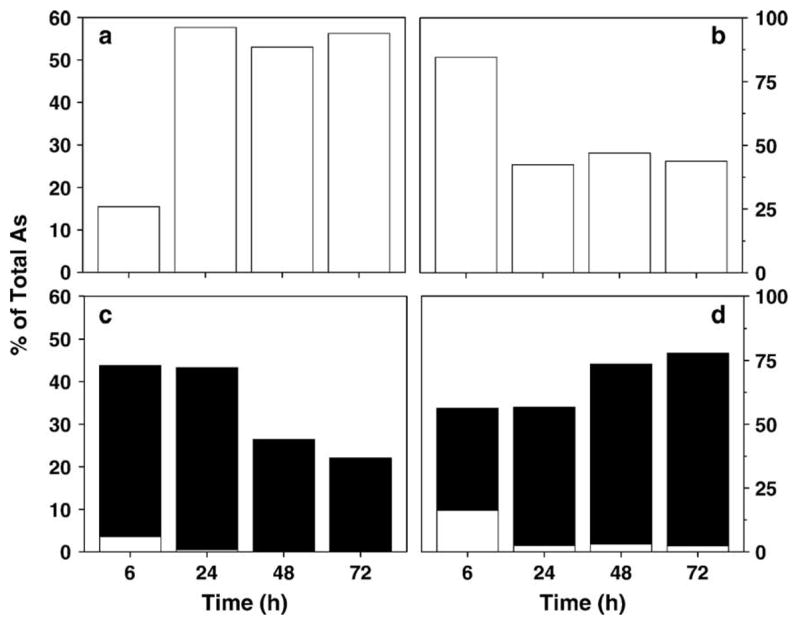
Production and distribution of metabolites, including MAs (□) and DMAs (■), in UROtsa and UROtsa/F35 cultures exposed to 1 μM MAsIII for 6, 24, 48, and 72 h. (a) Cell lysates and (b) media from UROtsa cultures; (c) cell lysates and (d) media from UROtsa/F35 cultures. Values are expressed as percentage of total As in culture (mean, n = 3).