Fig. 4.

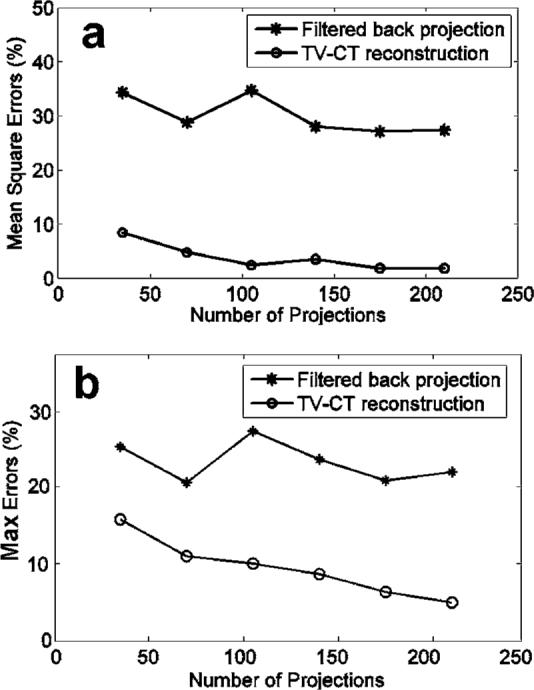
Plots of mean square errors (a) and maximum errors (b) of the reconstructed images against number of projections used in the reconstruction. Curves for filtered backprojection and TV-CT iterative method are included.

Plots of mean square errors (a) and maximum errors (b) of the reconstructed images against number of projections used in the reconstruction. Curves for filtered backprojection and TV-CT iterative method are included.