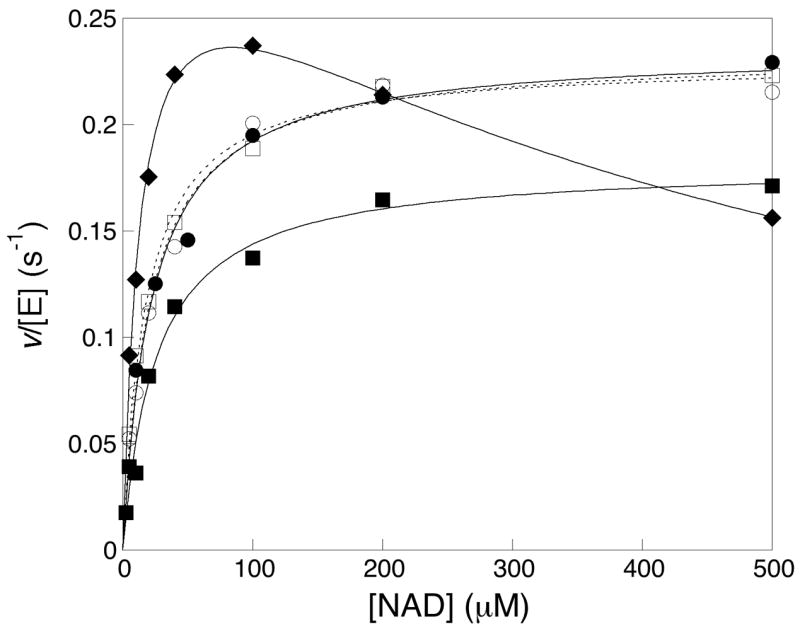
Figure 3.

Steady state kinetics of retinal IMPDH1 isoforms. The rate of NADH formation in the presence of saturating IMP (final concentration 500 μM) was divided by the monomeric concentration of IMPDH1 to obtain v/[E]. The values were plotted against the concentration of NAD+. The results obtained on the canonical IMPDH(514) were designated with closed diamonds (◆); IMPDH1(546), closed circles (●); IMPDH1(546)-D226N, open circles (○); IMPDH1(595), closed squares (■); IMPDH1(595)-D226N, open squares (□)]. Each data point represents the average value from at least three independent experiments.
