
Fig. 2.
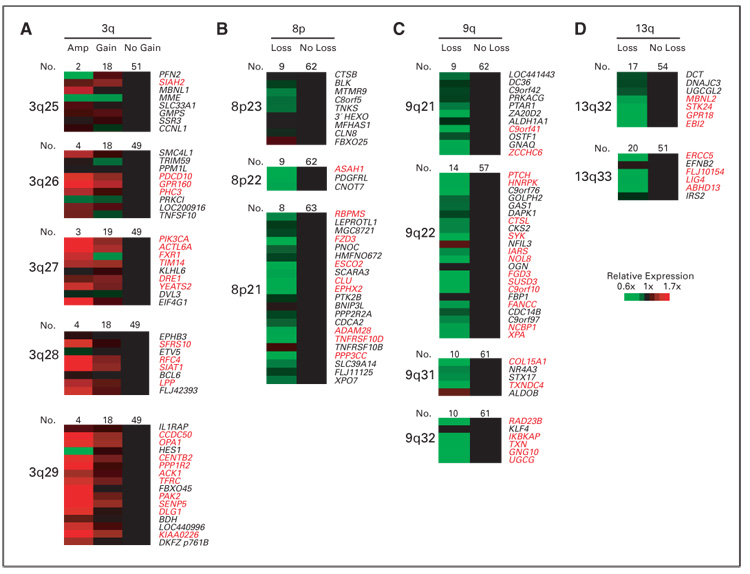
Influence of chromosomal alterations on locus-specific gene expression levels. (A) 3q, (B) 8p, (C) 9q, and (D) 13q. Genes are ordered according to their chromosomal position (Genes On Sequence Map, Homo sapiens built 33). For genes with more than one microarray element on the Lymphochip, the average expression from different clones was calculated. Genes with significant differences (P < .05) are highlighted in red. Amp, amplification.