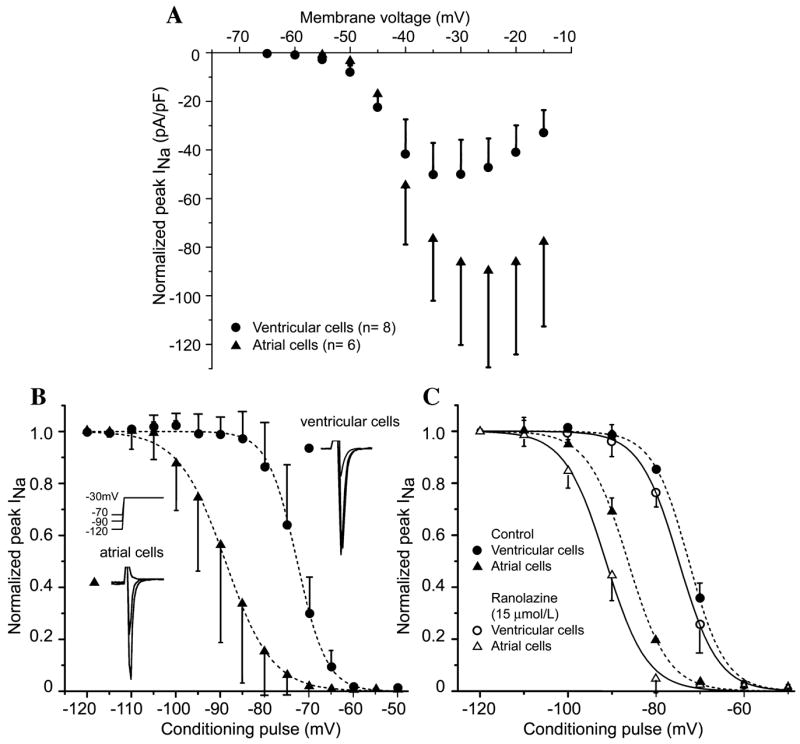
FIGURE 1.

Activation and steady-state inactivation in canine atrial versus ventricular myocytes. (A) Current–voltage relation in ventricular and atrial myocytes. Voltage of peak INa is more positive and current density is larger in atrial versus ventricular myocytes. (B) Summarized steady-state inactivation curves. The half-inactivation voltage (V0.5) is −88.80 ± 0.19 mV in atrial cells (n = 9) and −72.64 ± 0.14 mV in ventricular cells (P < 0.001, n = 7). Insets show representative atrial and ventricular traces after 1-s conditioning pulses to the indicated potentials. (C) Steady-state inactivation curves before and after addition of 15 μM ranolazine. Ranolazine shifts V0.5 from −72.53 ± 0.16 mV to −74.81 ± 0.14 mV (P < 0.01) in ventricular myocytes (n = 4) and from −86.35 ± 0.19 to −91.38 ± 0.35 mV (P < 0.001) in atrial myocytes (n = 5). (From Burashnikov et al.2 Reproduced with permission.)
