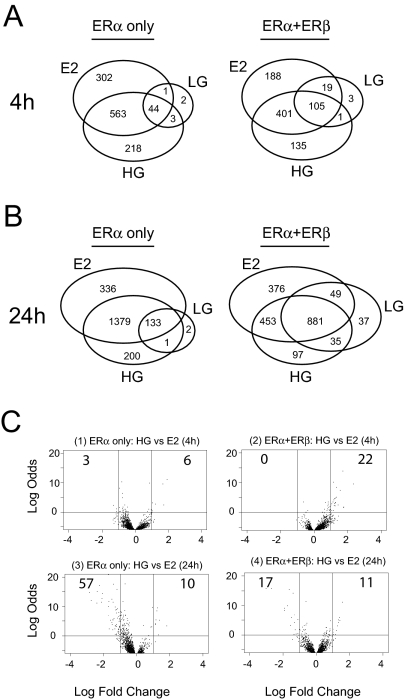
Figure 3.
At High Concentration, Genistein Elicits Gene Regulation Very Similar to that by E2
Venn diagrams comparing probe sets regulated by E2 (6 nm) or HG (300 nm) in MCF-7 cells expressing ERα alone or ERα+ERβ. A, Genes regulated at 4 h; B, genes regulated at 24 h; C, volcano plots (log odds vs. fold change) of HG-treated vs. E2-treated samples at 4 h in ERα-only cells (panel 1) or ERα+ERβ cells (panel 2) or at 24 h in ERα-only cells (panel 3) or ERα+ERβ cells (panel 4).

