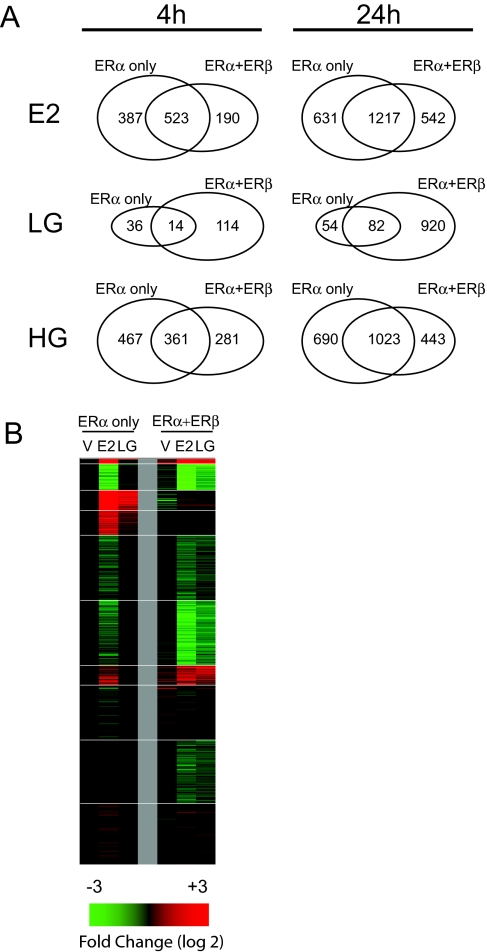
Figure 4.
ERβ Coexpression Enhances Gene Regulation by LG (6 nm)
A, Venn diagrams comparing probe sets regulated by E2 (6 nm), LG (6 nm) or HG (300 nm) in MCF-7 cells expressing ERα alone or ERα+ERβ; B, Heat map depicting 24-h gene expression of 1062 probe sets regulated by control vehicle (V), E2, or LG in MCF-7 cells expressing ERα only or ERα+ERβ.

