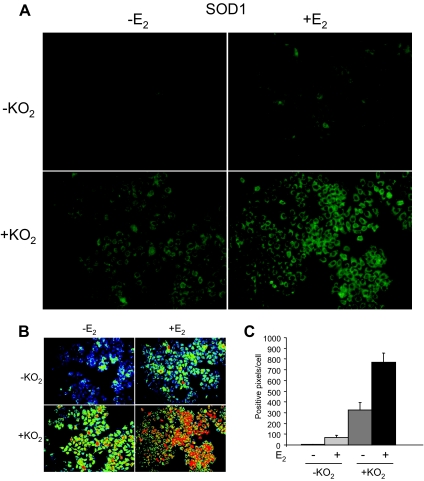
Figure 7.
Effect of E2 and KO2 on SOD1 Expression in MCF-7 Cells
A, MCF-7 cells were treated with ethanol vehicle or 10 nm E2 for 24 h. Potassium superoxide (KO2) was used to generate superoxide. Cells were exposed to KO2 for 1 h, media were removed, and samples were subjected to immunocytochemisty with an SOD1-specific antibody. B, The images shown in panel A were pseudocolored so that red corresponds to the highest intensity staining and black corresponds to the lowest intensity staining. C, The intensity of staining in 12 different fields (250–300 cells per field) from three independent experiments was analyzed by ANOVA. Each of the E2- and/or KO2-treated cells had significantly more SOD1 than cells that had been exposed to neither E2 nor KO2 (P ≤ 0.05).

