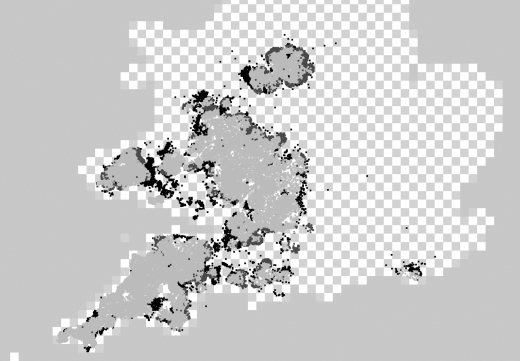
Figure 2.
Distributions of high-risk areas as estimated for 2004 (low within-herd spread model). Premises in both radius-based and parochial high-risk areas are shown in light grey, premises only in radius-based areas in dark grey, and only in parochial-based areas in black. Elsewhere is shown with a checked background.

