
FIG. 5.
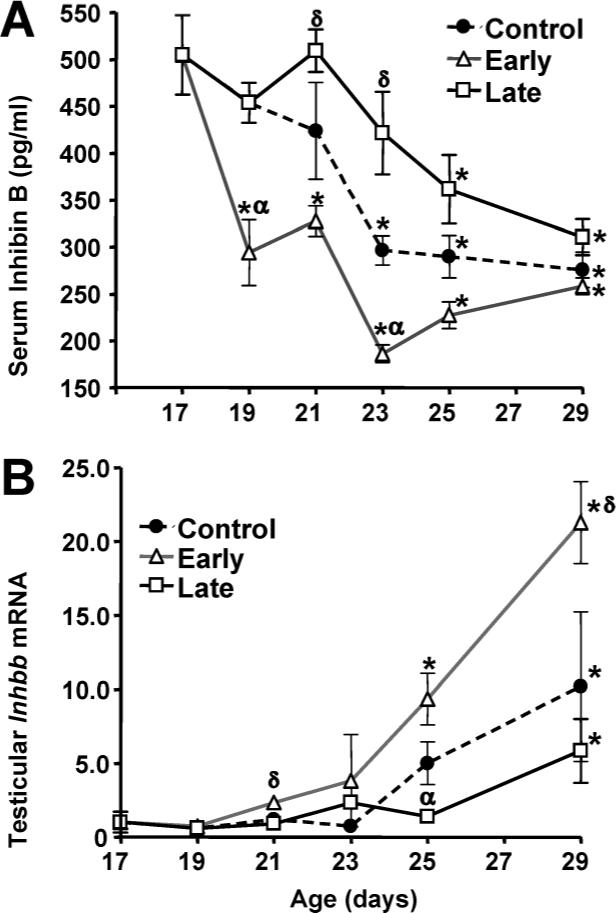
Effects of weaning manipulations on serum inhibin B and testicular Inhbb mRNA levels. Serum inhibin B concentrations (A) were measured by ELISA. Each value represents the mean ± SEM of 6 animals. Levels of testicular Inhbb mRNA (B) were determined by RT-PCR. Data are expressed as mRNA expression levels relative to Day 17 values. Each value represents the mean ± SEM of 6 animals. *, significantly different (P < 0.05) from Day 17 values within groups; δ, significantly greater (P < 0.05) than control values on the same day; α, significantly less (P < 0.05) than control values on the same day.