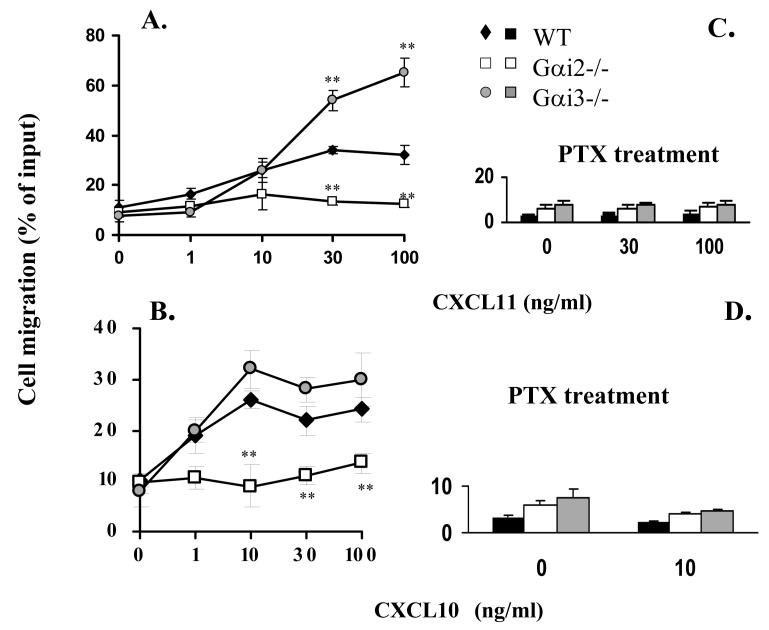
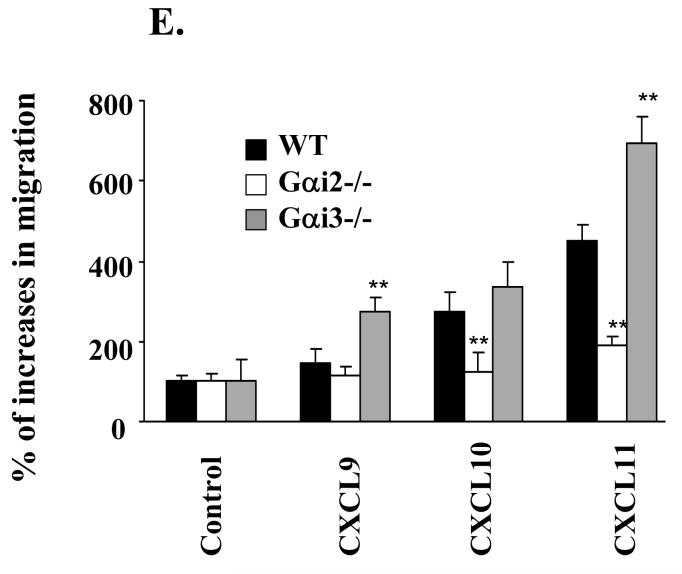
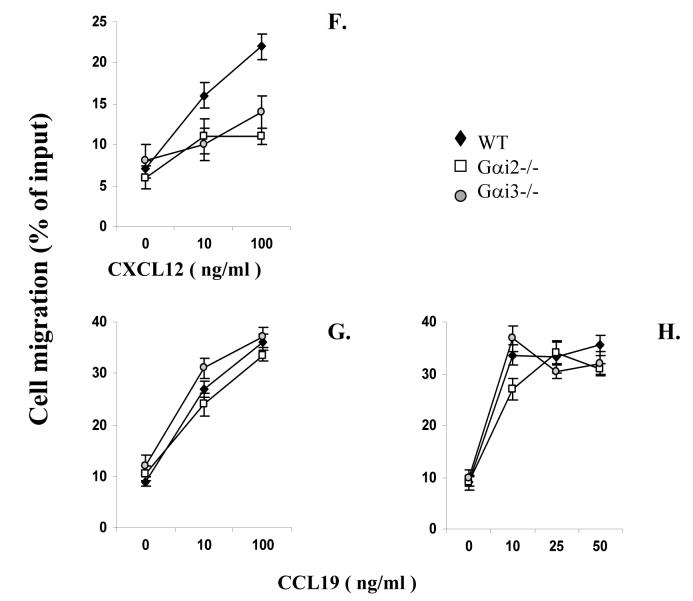
FIGURE 1.
Chemotactic responses in the presence or absence of Gαi2 or Gαi3. A-E. Gαi2 and Gαi3 have opposing effects on CXCR3-stimulated chemotaxis. Activated T cells prepared from wild type (WT), Gαi2-/-, and Gαi3-/- mice were either left untreated (A-B, and E) or treated with 100 ng/ml PTX overnight (C and D), and then added to the upper chamber. CXCR3 agonists at indicated concentrations were added to the lower chamber in triplicate. After 4 hr incubation, the migrated cells in the lower chamber were collected and counted. Data are presented as mean percentages ± standard derivations (SD) of cell migration relative to cell input. One representative experiment in A-D and cumulative data from at least five independent experiments (n = 15) in E are shown. Chemokine concentrations used in E were the optimal concentrations for stimulating maximal migration toward CXCL9 (100ng/ml), CXCL10 (10ng/ml), CXCL11 (100ng/ml). Medium controls are designated as 100% and mean percentages ± SD of cell migration relative to the control are shown. * and **, statistical significance (p < 0.05) or (p < 0.01) respectively, in the presence vs. absence of a specific Gαi protein. F-H. Varying effects of Gαi2 and Gαi3 on T cell chemotaxis induced by different chemokines. The migration was assayed as above, except that non-stimulated T cells were used in place of activated T cells in chemotactic responses to CXCL12 and CCL19 in F and G. Data are presented as mean percentages ± SD of cell migration relative to cell input as A and B. One representative result of three independent experiments with each performed in triplicate.


