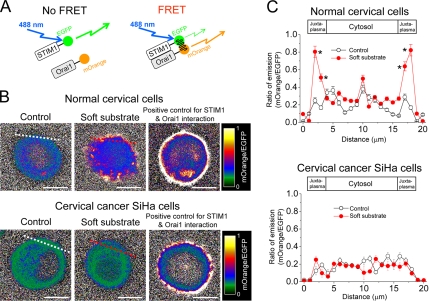
Figure 7.
The interaction between STIM1 and Orai1 detected by FRET measurement. (A) Model of FRET measurement. EGFP and mOrange were conjugated with STIM1 and Orai1, respectively, and used as a FRET pair. An optional 488 nm laser was used to directly excite EGFP without exciting mOrange. When EGFP–STIM1 and mOrange–Orai1 fusion proteins do not interact, illumination with blue (∼488 nm) light results in stronger EGFP fluorescence. As a result of Ca2+ depletion–induced interactions between EGFP–STIM1 and mOrange–Orai1, EGFP and mOrange are brought into proximity and excitation energy is transferred, resulting in stronger mOrange fluorescence. (B) Pseudocolor FRET images of emission ratio of mOrange to EGFP. Representative FRET images of normal cervical epithelial cells and cervical cancer cells cultured on different substrate rigidities for 4 h. The detailed information of FRET measurement was described in Materials and Methods. Cells treated with 2 μM thapsigargin were used as positive control for STIM1 and Orai1 interaction. Dashed lines indicate the area of quantitative analyses of emission ratio of mOrange to EGFP shown in C. Scale bar, 10 μm. (C) Quantitative analyses of emission ratio of mOrange to EGFP. Each point represents mean ± SEM from at least 15 cells. * p < 0.01, compared with control condition.

