Figure 7.
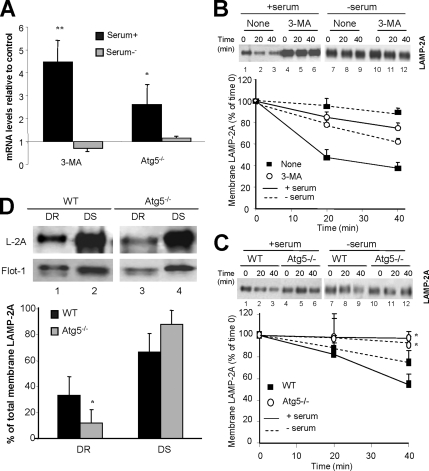
Mechanisms for CMA up-regulation in macroautophagy-impaired cells. (A) Transcriptional changes of the LAMP-2 gene. Semiquantitative real-time PCR was used to compare mRNA expression levels for LAMP-2A in total mRNA isolated from NIH3T3 cells treated or not with 3-MA and from wild-type and Atg5−/− mouse embryonic fibroblasts maintained in the presence (+serum) or absence (−serum) of serum. Values were corrected for actin amplification in each sample, and they are expressed as times the values in control cells (untreated NIH3T3 cells or wild-type MEFs), which were giving an arbitrary value of 1. Values are mean + SE from four different experiments (*p < 0.01 and **p < 0.001 compared with WT cells). (B and C) Lysosomal degradation of LAMP-2A. Lysosomes isolated from untreated (none) or 3-MA–treated NIH3T3 cells maintained in the presence or absence of serum for 6 h (B) and from WT or Atg5−/− mouse embryonic fibroblasts maintained in media with or without serum for 16 h (C) were incubated at 37°C in isotonic media in the absence of substrate proteins, supplemented with dithiothreitol and 1 mM CaCl2. The levels of LAMP-2A in aliquots taken at the indicated times were determined by immunoblot with the antibody against the cytosolic tail of LAMP-2A. A representative immunoblot (top) and the densitometric quantification of two to four immunoblots from different experiments (bottom) are shown. Values are expressed as percentage of LAMP-2A detected at time 0. (D) Association of LAMP-2A to lipid microdomains. Lysosomes isolated from WT and Atg5−/− mouse embryonic fibroblasts maintained in media supplemented with serum were subjected to extraction with Triton X-114. DR and DS regions were separated by flotation in sucrose density gradients as described under Materials and Methods, and then they were subjected to SDS-PAGE and immunoblot for LAMP-2A (L-2A) and flotillin-1 (Flot-1). A representative immunoblot (top) and the densitometric quantification of three immunoblots from different experiments (bottom) are shown. Values are expressed as percentage of total LAMP-2A at the lysosomal membrane present in each fraction.

