Figure 6.
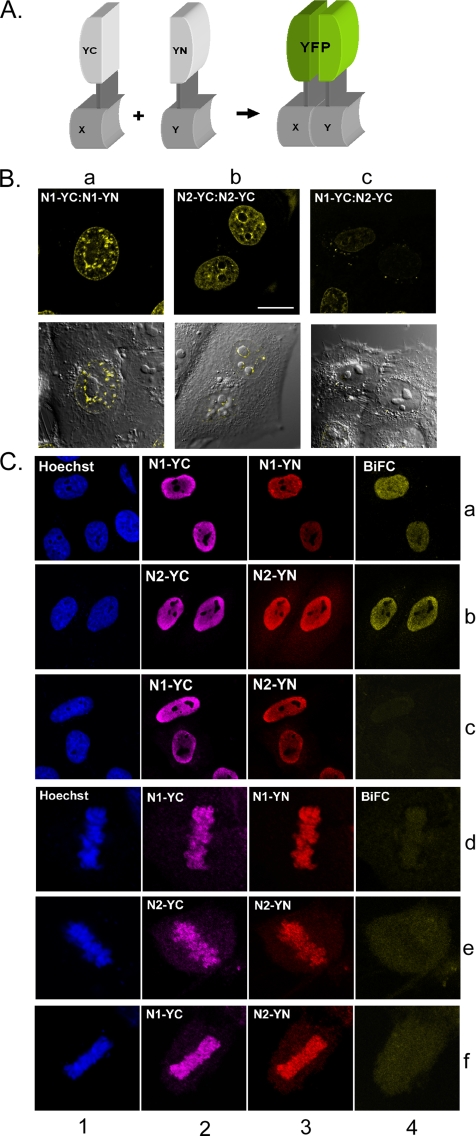
BiFC assays indicate difference in the organization of HMGNs in interphase and mitotic chromatin. (A) Schematic diagram showing the principle of BiFC. For BiFC, two proteins were fused to the nonfluorescent halves (YC-partner and YN-partner) of YFP. Complementation of functional fluorescent fluorophores is diagnostic of stable interaction of the fusion proteins. Because YC-partners also contain an HA-tag and the YN-partners contain a Flag-tag, expression of both BiFC partners can be visualized by immunofluorescence. (B) BiFC assays of live cells. The fusion proteins expressed in the cells are indicated. Note that cells expressing one type of HMGN fused to the two parts of YFP produced a BiFC signal (a and b), whereas cells transfected with HMGN1 and HMGN2, each fused to a different fragment of the YFP, did not (c). (C) Immunofluorescence analyses of the expression of the fusion proteins. Note that combinations that produce strong BiFC in interphase did not produce a signal in metaphase even though the proteins are associated with chromosomes (compare a, b with d, e; lanes 4). DNA staining is shown in blue; the immunolocalization of YC-partners bearing HA-tags, detected with anti Cy5-labeled secondary antibody, is shown in magenta. The immunolocalization of YN-partners bearing Flag-tag HA-tags, detected with Tx-Red labeled secondary antibody is shown in red. The complemented YFP-fluorescence (BiFC) is shown in yellow. Absence of yellow (in row 4, c and d) indicates lack of BiFC.

