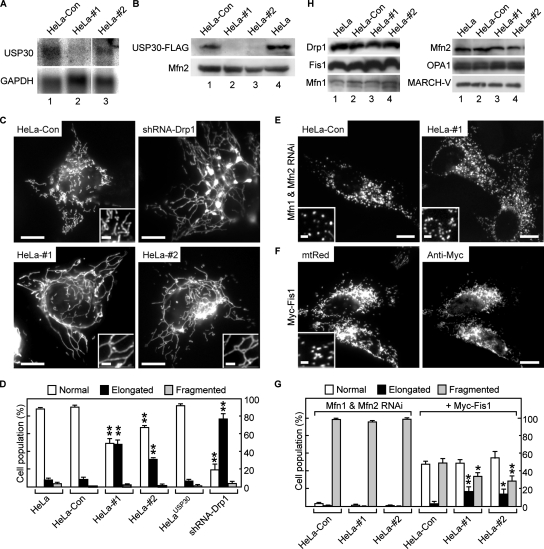
Figure 5.
Effect of USP30 knockdown on mitochondrial morphology. (A) Northern blot of 2 μg of poly(A)+ RNA purified from HeLa-Con (lane 1), HeLa-#1 (lane 2) or HeLa-#2 (lane 3) cells was hybridized with specific probes for USP30 (top) and GAPDH (bottom). (B) HeLa-Con (lane 1), HeLa-#1 (lane 2), HeLa-#2 (lane 3), and parental HeLa (lane 4) cells were transiently transfected with USP30-FLAG. The membrane fractions of the cells (20 μg of protein) were analyzed by Western blotting with antibodies against FLAG (top) and Mfn2 (bottom). (C) The mtRed-expression vector was used to transfect HeLa-Con (top left), HeLa-#1 (bottom left), and HeLa-#2 (bottom right) cells or to cotransfect HeLa cells with shRNA-Drp1 (top right). The cells were analyzed by fluorescence microscopy 24 h (HeLa-Con, HeLa-#1, and HeLa-#2 cells) or 48 h (shRNA-Drp1) after transfection. Signals for mtRed are shown. Insets show higher magnification images in the peripheral regions of the cells. Bars, 10 and 2 μm in the insets. (D) The bar graph shows the percentage of HeLa, HeLa-Con, HeLa-#1, HeLa-#2, HeLaUSP30, and HeLa cells expressing shRNA-Drp1 having the indicated mitochondrial morphology. Data are expressed as the means ± SD of triplicate. **p < 0.01 compared with the same morphology in HeLa-Con cells. (E) HeLa-Con (left) and HeLa-#1 (right) cells were transiently transfected with mtRed together with Mfn1 and Mfn2 shRNAs. The cells were analyzed by immunofluorescence microscopy 72 h after transfection. Signals for mtRed are shown. Insets show higher magnification images in the peripheral regions of the cells. Bars, 10 and 2 μm in the insets. (F) HeLa-#1 cells were transiently transfected with mtRed together with Myc-Fis1. At 24 h after transfection, the cells were stained with anti-Myc antibody and then observed by immunofluorescence microscopy. Signals for mtRed (left) and anti-Myc antibody (right) are shown. The inset shows a higher magnification image in the peripheral region of the cell. Bars, 10 and 2 μm in the inset. (G) The bar graph shows the percentage of the designated cells expressing Mfn1 and Mfn2 shRNAs (Mfn1 and Mfn2 RNAi) or Myc-Fis1 and having the indicated mitochondrial morphology. Data are expressed as the means ± SD of triplicate samples. *p < 0.05 and **p < 0.01 compared with the same morphology in HeLa-Con cells under the same conditions. (H) The membrane fractions (20 μg of protein) of HeLa (lane 1), HeLa-Con (lane 2), HeLa-#1 (lane 3), and HeLa-#2 (lane 4) cells were analyzed by Western blotting by using antibodies specific for the indicated antigens.

