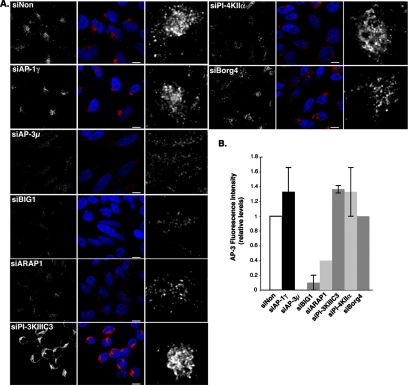
Figure 6.
AP-3 localization in siRNA-treated cells. (A) Cells transfected for 72 h with siRNAs against the indicated molecules or with control nontargeting siRNAs (siNon) were then fixed, permeabilized, and labeled with antibodies against AP-3δ (red). The cells were analyzed by fluorescence confocal microscopy. Right, AP-3δ signal at higher magnifications. Bars, 10 μm. (B) Total cellular intensity of the AP-3δ signal was quantified for each condition, and the averages were plotted relative to control (value = 1) and to the siAP-3 (value = 0). n = 2 independent experiments performed in triplicates with 100 cells/condition.

