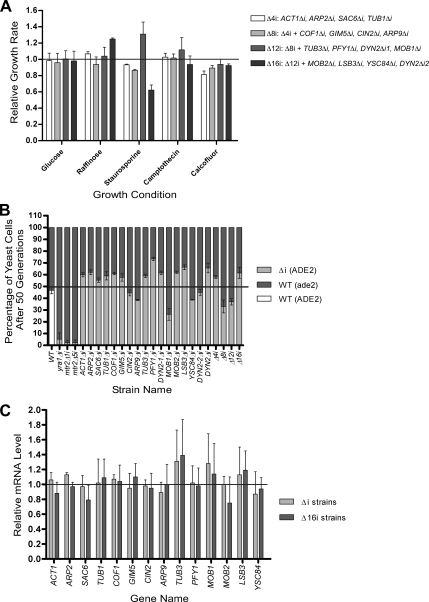
Figure 5.
Phenotypic analysis and expression profiling of yeast strain carrying multiple intron deletions in genes associated with cytoskeleton. (A) Maximum growth rate of different strains carrying multiple intron deletions in cytoskeleton-related genes was obtained and plotted relative to that of a wild-type strain. Growth conditions inducing the greatest variance between the wild-type and mutant strains are shown (X axis). The data are an average of at least three different experiments. Strain carrying intron deletions in ACT1, ARP2, SAC6, and TUB1 genes (Δ4i) is indicated with white bars. Light gray bars, the strain carrying Δ4i deletions plus additional ones in COF1, GIM5, CIN2, and ARP9 genes (Δ8i); gray bars, Δ12i strain that carries Δ8i deletion plus deletions in TUB3, PFY1, DYN2_1 and MOB1 genes; dark gray bars, Δ16i that carries the Δ12i deletions plus additional one in MOB2, LSB3, YSC84 and DYN2_2 genes. (B) Competitive growth assay of wild type and intron-deletion strains in rich media (fitness test). Mixed cultures were started by adding equal quantities of cells from wild-type (ade2Δ) and intron deletion strains (Δi; ADE2) in YPD containing 100 μg/ml adenine to avoid the accumulation of the red pigmentation of ade2 mutants. The mixed cultures were grown at 30°C and diluted each day until 50 generations (± 2) were reached. At generation 0 and 50, the number of mutant (white) and wild-type (red) cells was counted by plating 300 cells (±44) on SC plates containing a low concentration of adenine (20 μg/ml), and the initial and final percentages of each strain was calculated. The initial percentages were set to 50:50 (black line), and the final percentages shown in the graph were relative to this ratio. Dark gray bars, the percentage of wild-type cells; light gray bars, the percentage of cells carrying intron deletion. Competitive growth assays were performed with two wild-type strains that have different background (ADE2, white bar; and ade2Δ) as negative control and also with wild-type and yra1Δi, wild-type and mtr2Δ1i, and wild-type and mtr2Δ5i strains as positive controls. The strains are indicated on the X-axis. n = 3 for the individual experiments, except for the multiple intron deletion strains, where the data represent six different experiments. (C) Expression profiling of cytoskeleton related mRNAs before and after intron deletions. The abundance of each mRNA associated with the cytoskeleton was determined in wild-type cells, cells carrying a single deletion in the gene analyzed (light gray bars), or cells carrying multiple deletions in all cytoskeleton related genes (gray bars). The RNA was quantified using Northern blot, normalized using internal controls, and plotted relative to the expression of the wild-type mRNA. The data represent average values for RNA obtained from two different cultures grown independently in duplicates.

