
Figure 2.
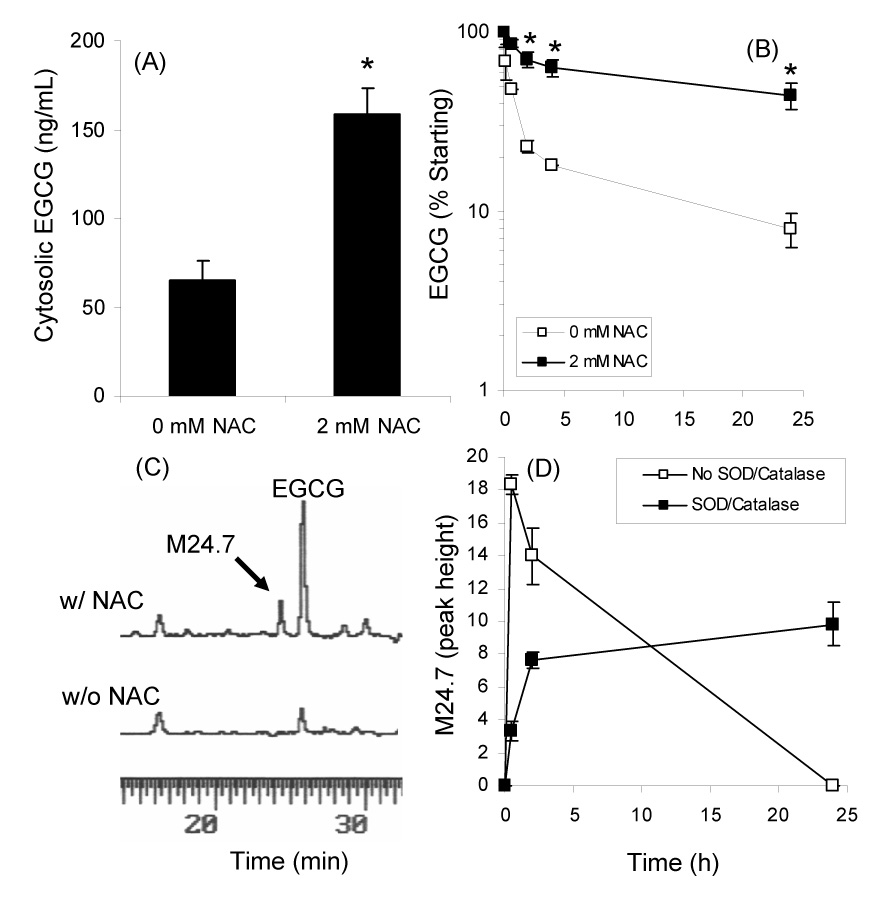
Effect of 2 mM NAC on the cytosolic levels (A) and stability (B) of EGCG in the presence of CL13 mouse lung adenocarcinoma cells. (C) HPLC analysis of medium from CL13 cells treated with 100 µM EGCG alone or in combination with 2 mM NAC. (D) Formation of novel peak M24.7 under cell culture conditions in the presence of 100 µM EGCG, 2 mM NAC, and CL13 cells. Each point represents n = 3. Error bars represent the SD. * = p < 0.05 by two-tailed Students’ t-test