
Figure 3.
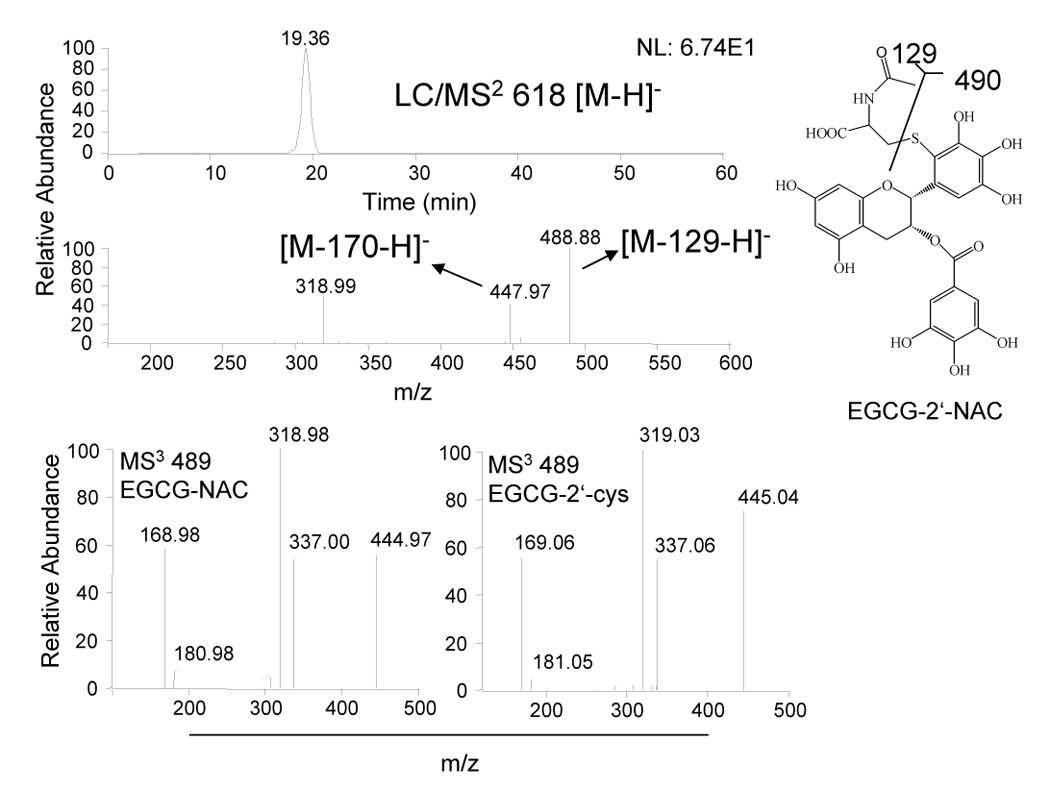
LC-MS analysis of medium from CL13 cells treated with 100 µM EGCG alone or in combination with 2 mM NAC. Medium and cytosol were collected after 24 h treatment of CL13 cells in the presence of 5 U/mL SOD, 30 U/mL catalase, and 10% FBS. Structure of EGCG-NAC conjugate as determined by LC-MS.