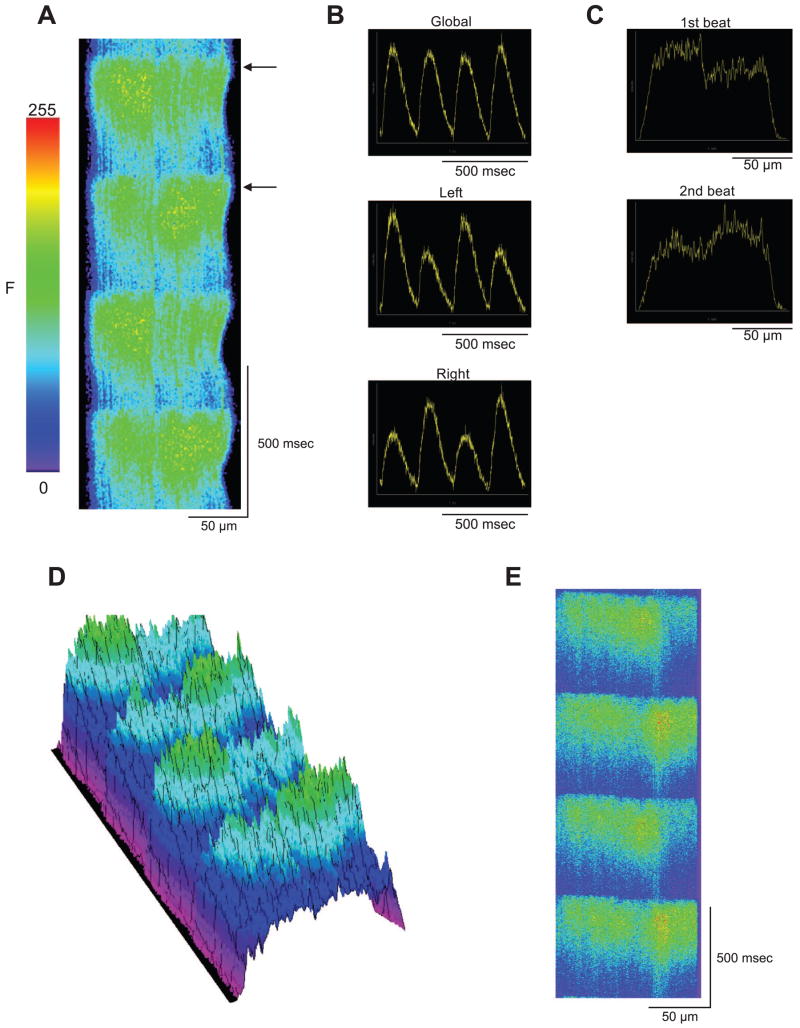
Fig. 5.
A: representative line scan image showing subcellular alternans. B: the integrated global fluorescence trace appears uniform and does not show any alternation. However, when one only half of the cell is analyzed, alternans is plainly apparent. C: analysis of the space plot from 2 successive beats shows heterogeneity of the Ca2+ levels across the length of the cell (black arrows in A). D: 3-dimensional reconstruction of A. This provides an impression of the distribution of Ca2+ during subcellular alternans. The alternans occurring in half the cell is clearly out of phase with alternans in the other half of the cell. E: representative line scan image showing that subcellular alternans occurs in the presence of latrunculin B and cytochalasin D.

