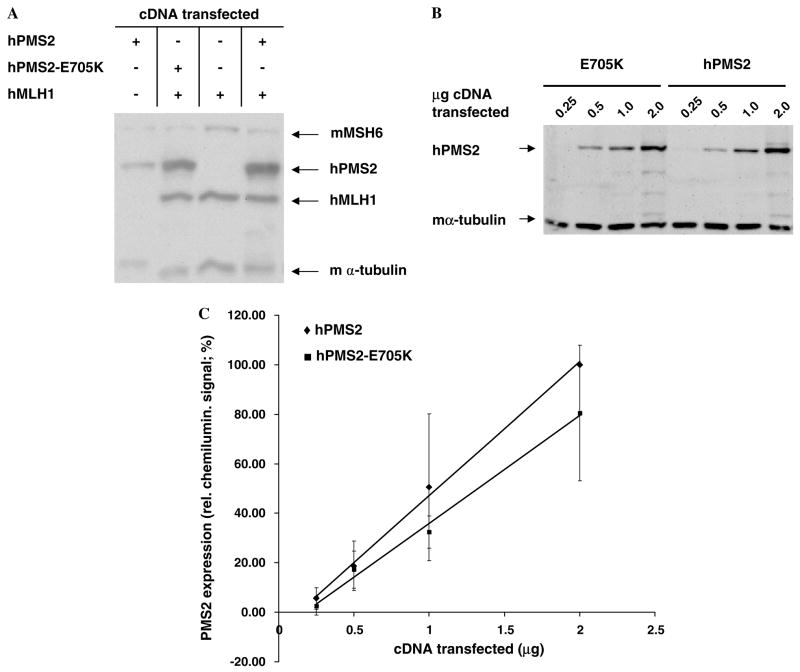
Fig. 2.
Expression of hPMS2-E705K in transiently transfected mouse cells. (A) Representative immunoblot of whole cell lysates (WCLs) of MP1 cells transfected with hMLH1 (1 μg). hPMS2 (0.25 μg,), and/or hPMS2-E705K (0.25 μg) cDNAs, together with pCPB (1.25–1.5 μg) and pCNB (0.5–1.5 μg) empty vector DNAs to bring the total amount of DNA transfected to 3 μg. (B) Representative immunoblot of WCLs of MP1 cells transfected with 0.25–2 μg of hPMS2 or hPMS2-E705K cDNAs. (C) Quantitative analysis of PMS2 expression in MP1 cells transfected with increasing amounts of hPMS2 versus hPMS2-E705K cDNAs. Each point on the graph represents the average of 3–4 experiments consisting of duplicate transfections. Linear regression was performed on each data series.

