
Figure 1.
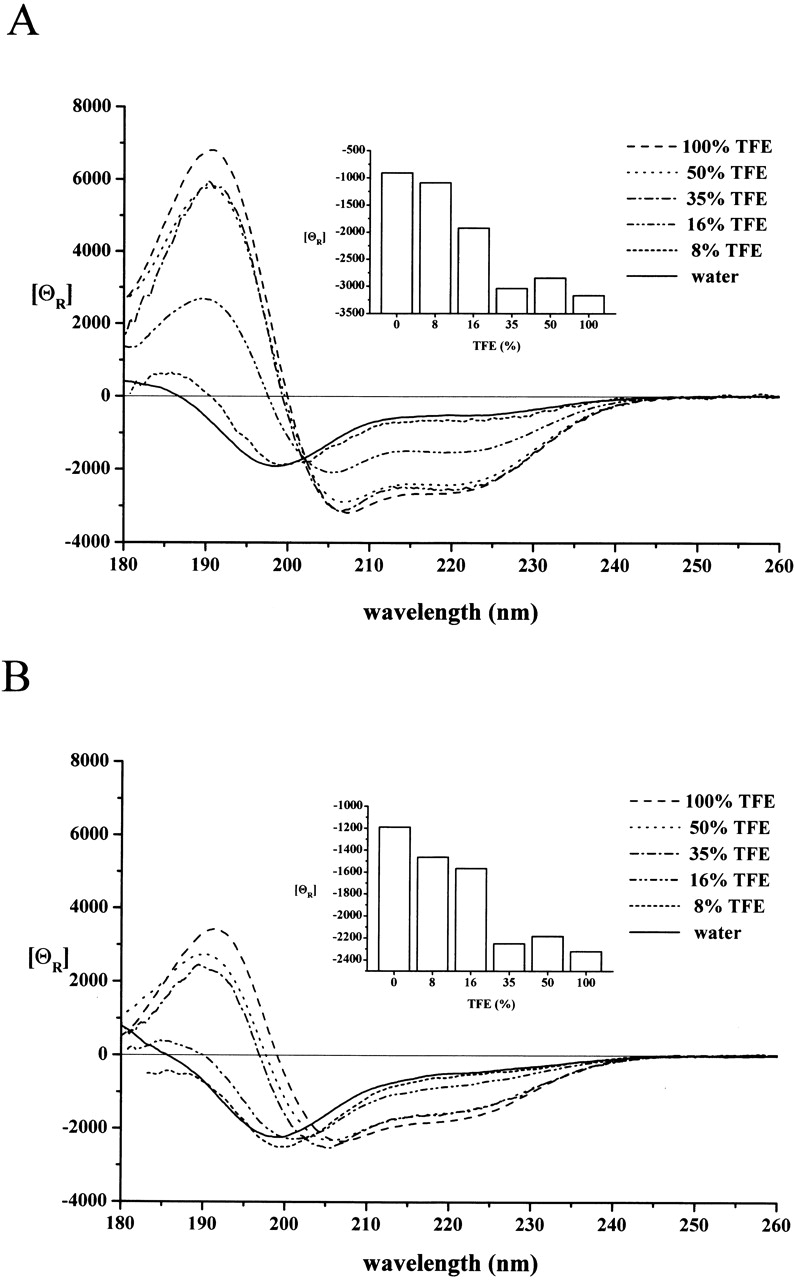
CD spectra of peptides A and C in water–TFE solutions. The CD spectrum of peptide A (A) and peptide C (B) at 0.7 mM concentration was recorded in water–TFE mixtures containing TFE at the percentages indicated. The conformational change in both cases corresponds to a transition to an α-helix conformation. The molar ellipticity values recorded at 208 nm, mainly contributed by the α-helix conformation of the peptides, reach half-maximal values at TFE concentrations of 16% for peptide A and ~25% for peptide C (insets).