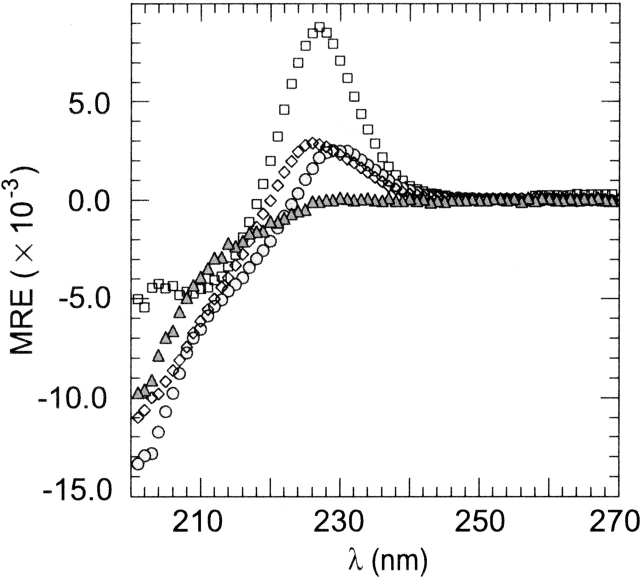
Figure 3.
CD spectra of the WW proteins at 2°C. Molar residual ellipticities are given in mdeg cm2/dmole. (□) Wild-type WW from hPin1; (⋄) W29A hPin1; (▵) SPANS–WW1; (○) SPANS–WW2. Buffer conditions were 10 mM MOPS at pH 7.2 (10 mM phosphate at pH 7.0 for SPANS–WW2), and 100 mM NaCl; protein concentrations were ~50 μM.

