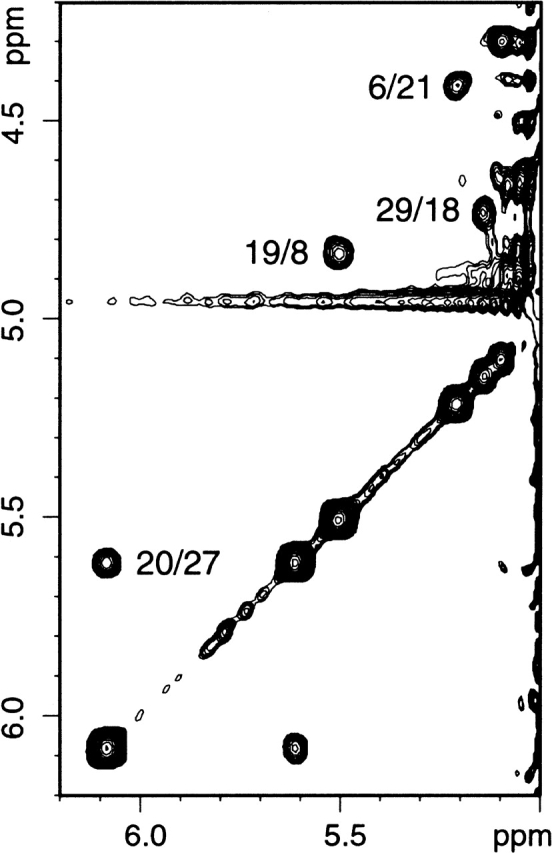
Figure 9.

Portion of a SPANS–WW2 NOESY spectrum. Protein concentration was 700 μM in D2O at pH 7 and 5°C. The CαH-CαH NOEs determine the register of the three-stranded β sheet. Cross-peaks are labeled i/j; the chemical shift of i is read in the direct dimension.
