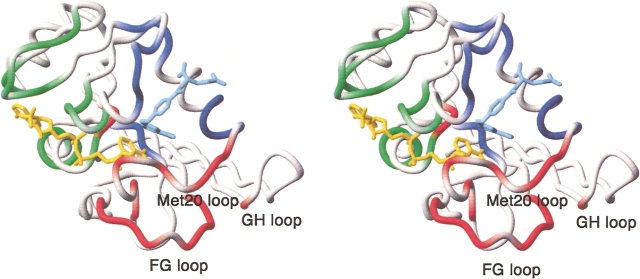
Figure 5.
Location of chemical shift marker residues in the DHFR structure. Residues whose 1HN or 15N resonances reflect cofactor binding are shown in green; those that indicate folate binding are blue; and markers of the Met 20 loop conformation are shown in red. The figure was made using MOLMOL (Koradi et al. 1996) from the coordinates of the E:folate:NADP+ complex (1rx2). The NADP+ cofactor is yellow, and the folate is shown in pale blue.

