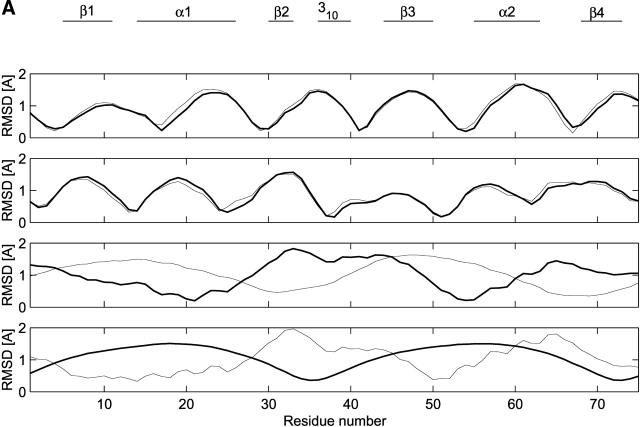
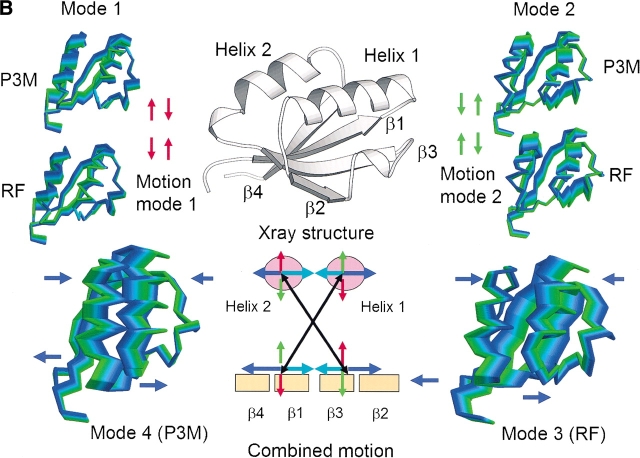
Figure 3.
Analysis of the first four essential modes. (A) RMSD (for backbone atoms) corresponding to a trajectory built along the first four eigenvectors (identified as 1, 2, 3, 4) calculated from the RF and P3M simulations (interval 500–2000 psec). RMSD values were referred to X-ray structure. Thin line, RF simulation; thick line, P3M simulation. (B) Comparison between modes 4 of P3M and 3 of RF and modes 1 and 2 of RF and P3M simulations. Snapshots were taken from the trajectory obtained by the projection of the modes on the simulation. The starting conformation is in green and the last in blue. The X-ray structure of ADBp is shown at the top, indicating the main conformational features; the structure corresponds to the starting structure on the snapshots showing the modes’ motion. Arrows indicate the cross-motion involved with modes 4 of P3M and 3 of RF. The combined motion is shown by arrows taken from modes 1 of P3M and RF (red), modes 2 of P3M and RF (green), and cross-modes 3 and 4 of RF and P3M (in blue and cyan). The motion is represented by a cross that correlates the two portions of the fold: helix 2 with strands 3 and 2; helix 1 with strands 1 and 4.


