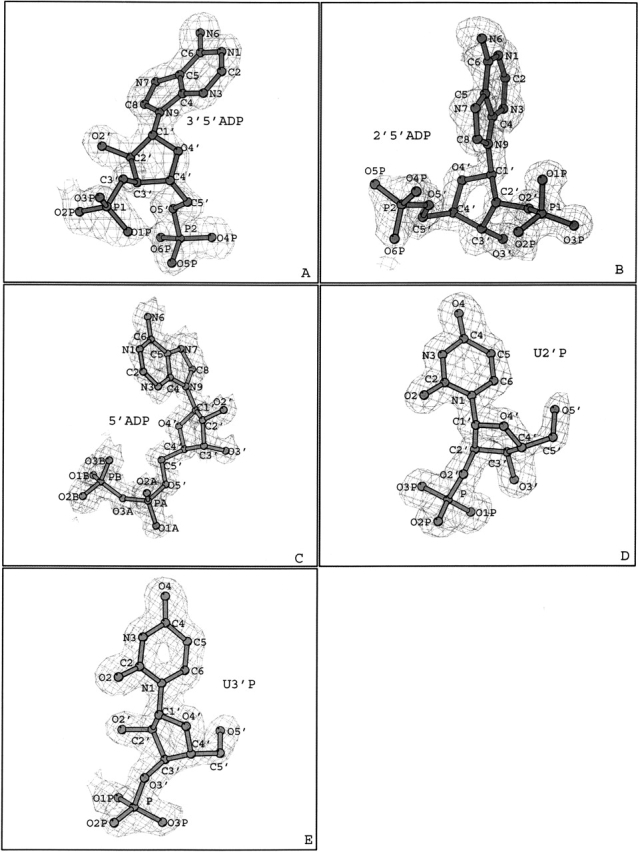
Figure 1.

(A–E) Diagrams of the sigma 2|Fo| − |Fc| electron density maps for 3′,5′-ADP, 2′,5′-ADP, 5′-ADP, U-2′-p, and U-3′-p, respectively. Electron density maps were calculated with CNS (Brünger et al. 1998) from the RNase A model before incorporating the coordinates of each inhibitor, are contoured at 1.0 σ level, and the refined structure of the inhibitor is shown. General numbering scheme for each inhibitor is also shown. The figure was prepared with BOBSCRIPT (Esnouf 1997).
