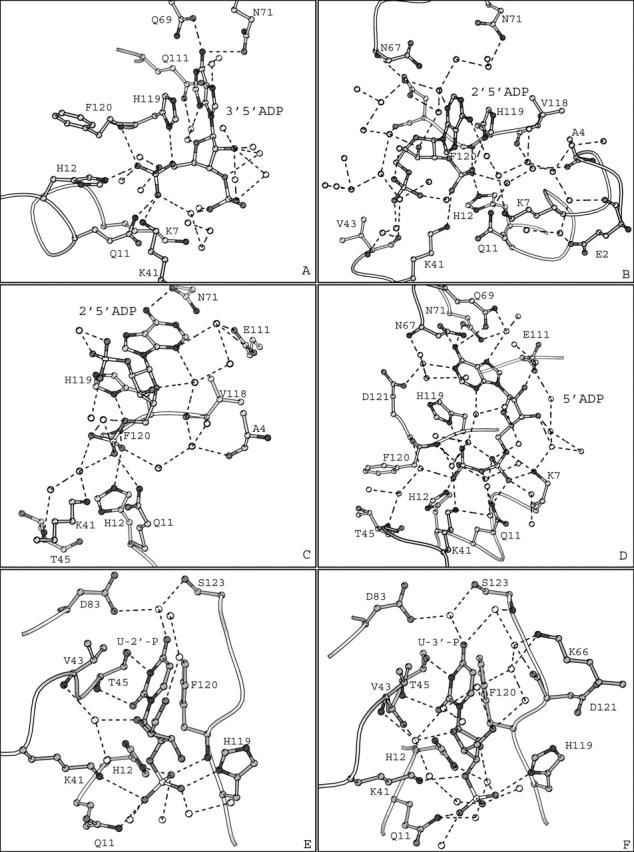
Figure 2.

(A, B, D, E, and F) Diagrams of the interactions between RNase A molecule I of the asymmetric unit and 3′,5′-ADP, 2′,5′-ADP, 5′-ADP, 2′ UMP, and 3′ UMP, respectively. (C) Diagram of the interactions between RNase A and 2′,5′-ADP in molecule II of the asymmetric unit. Molecules I and II refer to the two RNase A molecules in the asymmetric unit. Residues are drawn as ball-and-stick models and water molecules as white spheres. Hydrogen bonds are indicated as dashed lines.
