
Figure 9.
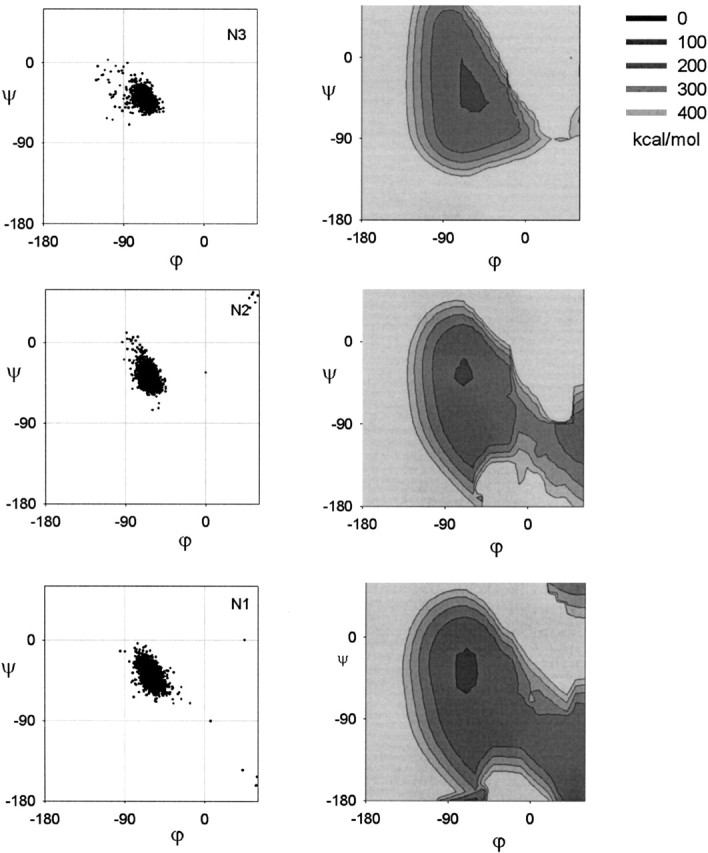
The Ramachandran plot of the amino-terminal residues. The left column gives the observed distribution. The right column gives the energy map of the H-bonding constraints and Lennard-Jones potential. The Ramachandran plot has been truncated for clarity.