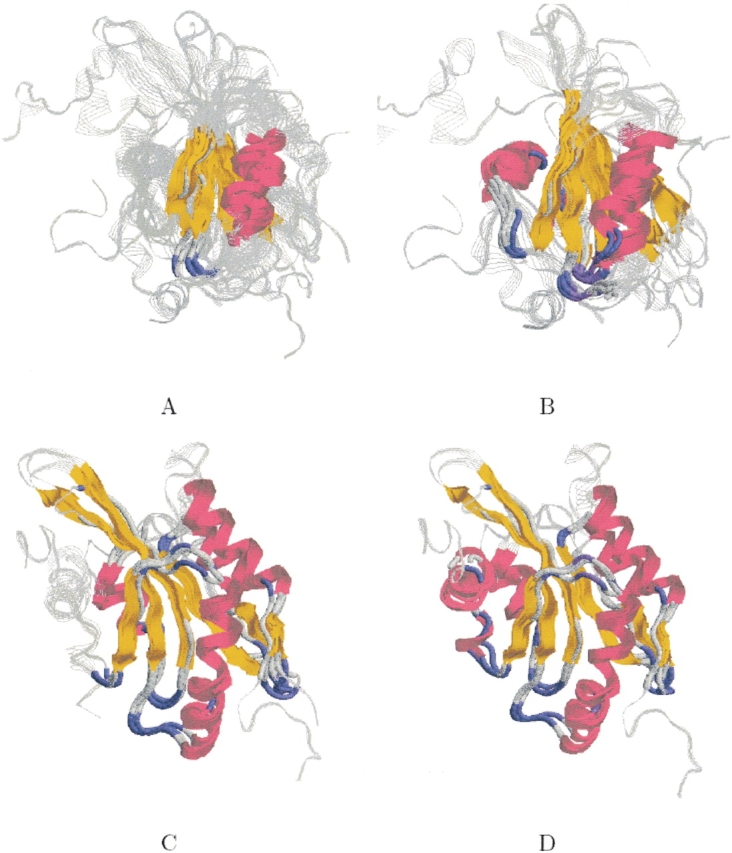
Figure 4.

CL–GL ensemble. The figure shows four different subset alignments. The backbone of the proteins is displayed in RasMol strands representation (Sayle and Milner-White 1995) and is colored gray. The structurally conserved core detected by MASS is colored by secondary structure (helices are colored magenta, strands are colored yellow, turns are colored blue, and all other residues are colored light gray). (A) The structural alignment of all 12 proteins of the ensemble. (B) A subset alignment between only the eight GL proteins. (C) A subset alignment between only the four CL structures. (D) A subset alignment between only three out of the four CL structures. The outlier is PDB:1f7s, which lacks the C-terminal α-helix.
